
Hello guys!
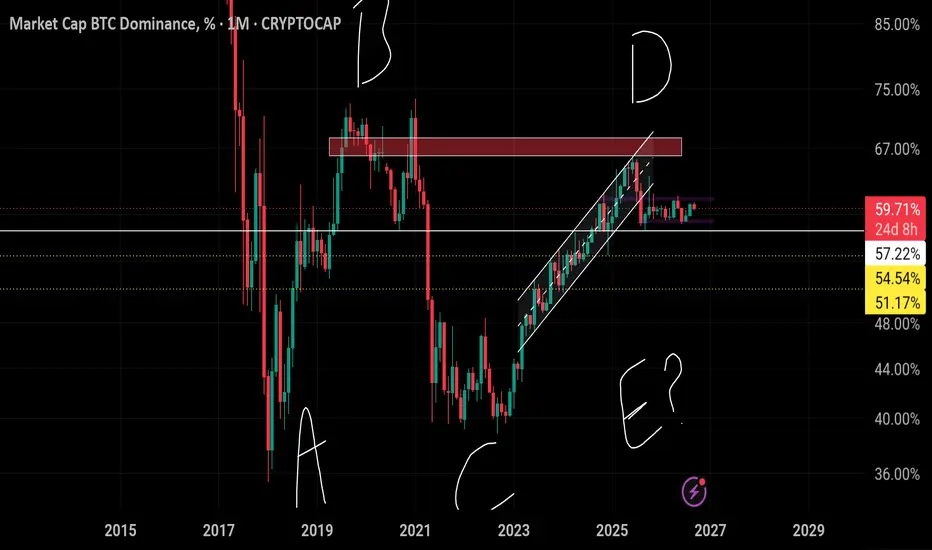
We're looking at Bitcoin dominance on the monthly chart. It's been ranging for several months now, which is exactly why altcoins have been moving in sync with Bitcoin's fluctuations, without showing their own strength.
Based on Elliott Wave counts and the break below the channel support after hitting a supply zone, a monthly close below the 57.2% level would turn the trend bearish for this index. It could potentially drop as low as 52–54%.
The key is the combination: if dominance falls and at the same time BTC holds steady or goes up, that's when altcoins will likely pump hard.
NFA-DYOR
Dont forget to follow!
JavanshirAcademy
retrader

Financial Service - Educational Academy - Investment Platform - Option Trading _ Option Strategist ...
คำจำกัดสิทธิ์ความรับผิดชอบ
ข้อมูลและบทความไม่ได้มีวัตถุประสงค์เพื่อก่อให้เกิดกิจกรรมทางการเงิน, การลงทุน, การซื้อขาย, ข้อเสนอแนะ หรือคำแนะนำประเภทอื่น ๆ ที่ให้หรือรับรองโดย TradingView อ่านเพิ่มเติมใน ข้อกำหนดการใช้งาน