
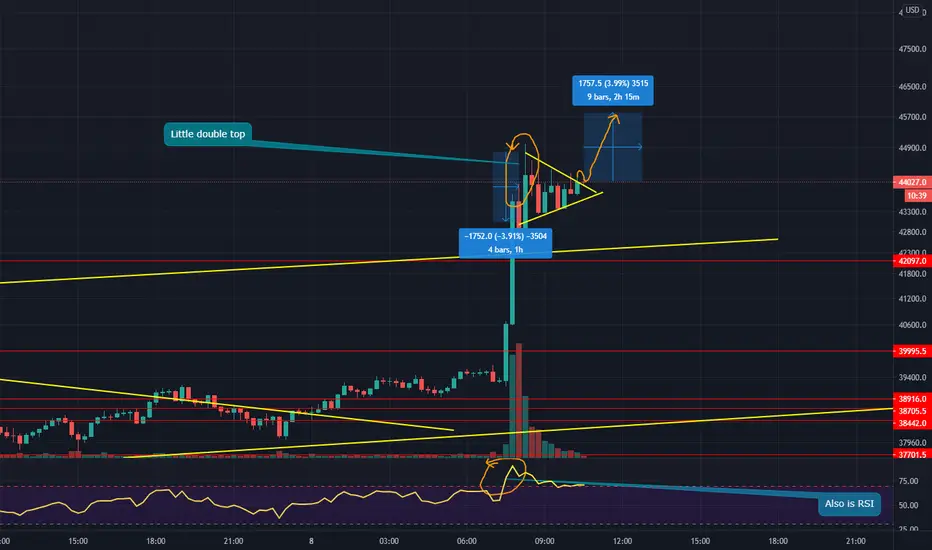
There is a little triangle the can be seen here after a small double top.
If you look at the 5m timeframe it can be seen much better. From both the chart and RSI.
There seems to be a breakout and is now retesting that line. So it will most likely go up from here at least a little bit.
If you look at the 5m timeframe it can be seen much better. From both the chart and RSI.
There seems to be a breakout and is now retesting that line. So it will most likely go up from here at least a little bit.
บันทึก
Looks like it did pop up a little after breaking and is now forming a bigger triangle with previous resistance.
คำจำกัดสิทธิ์ความรับผิดชอบ
ข้อมูลและบทความไม่ได้มีวัตถุประสงค์เพื่อก่อให้เกิดกิจกรรมทางการเงิน, การลงทุน, การซื้อขาย, ข้อเสนอแนะ หรือคำแนะนำประเภทอื่น ๆ ที่ให้หรือรับรองโดย TradingView อ่านเพิ่มเติมใน ข้อกำหนดการใช้งาน
คำจำกัดสิทธิ์ความรับผิดชอบ
ข้อมูลและบทความไม่ได้มีวัตถุประสงค์เพื่อก่อให้เกิดกิจกรรมทางการเงิน, การลงทุน, การซื้อขาย, ข้อเสนอแนะ หรือคำแนะนำประเภทอื่น ๆ ที่ให้หรือรับรองโดย TradingView อ่านเพิ่มเติมใน ข้อกำหนดการใช้งาน