
Hello
It's a Bitcoin Guide.
My analysis is optimized for TradingView.
If you press the Replay button, you can check real-time movements.

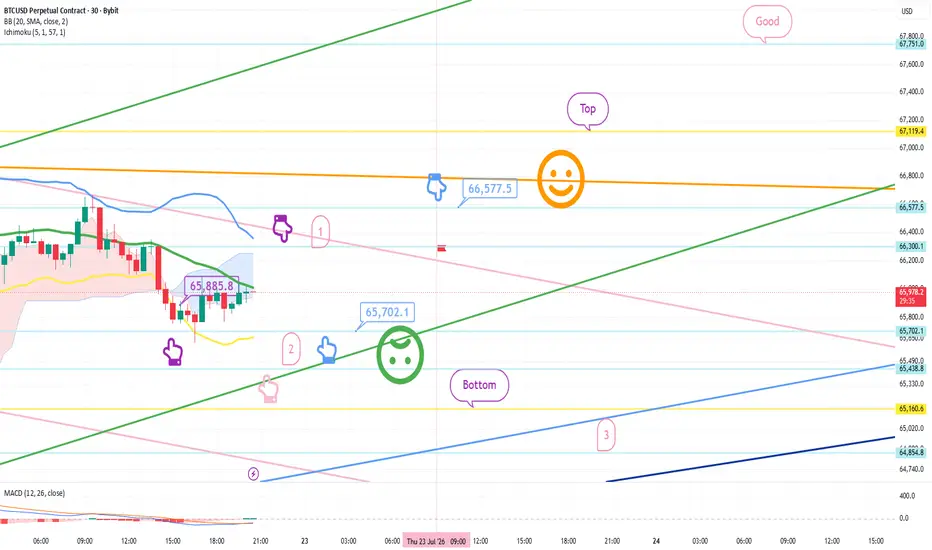
This is the Bitcoin 30-minute chart.
Currently, a MACD Dead Cross is in progress on the 4-hour chart.
On the left, marked with a purple finger,
I have connected the strategy exactly as it was from yesterday, using the entry point at $65,885.8 for the long position.
*Starting from the point touched first at section 1 at the top or section 2 at the bottom,
this is a two-way neutral strategy.
1) If the purple finger at the top (Section 1, $66,300.1) is touched:
Short position entry point / Stop loss if the orange resistance line is broken.
2) Switch to a long position at $65,702.1 / Stop loss if the green support line is broken.
- The stop loss is the same for those who held a long position at $65.8K yesterday.
3) $66,577.5 Long position 1st target -> Target prices in the order of Top, Good.
* If the price at the bottom (Section 2, $65,438.8) is touched:
Long position entry point / Stop loss if the green support line is broken. The target price is the same as the one at the top.
- From the point where the green support line is broken,
the Bottom (indicated at the bottom) -> up to Section 3 is open, so
you must exercise caution.
Please use my analysis post only as a reference and for practical application.
I hope you operate safely by strictly adhering to trading principles and stop loss rules.
thank you
It's a Bitcoin Guide.
My analysis is optimized for TradingView.
If you press the Replay button, you can check real-time movements.
This is the Bitcoin 30-minute chart.
Currently, a MACD Dead Cross is in progress on the 4-hour chart.
On the left, marked with a purple finger,
I have connected the strategy exactly as it was from yesterday, using the entry point at $65,885.8 for the long position.
*Starting from the point touched first at section 1 at the top or section 2 at the bottom,
this is a two-way neutral strategy.
1) If the purple finger at the top (Section 1, $66,300.1) is touched:
Short position entry point / Stop loss if the orange resistance line is broken.
2) Switch to a long position at $65,702.1 / Stop loss if the green support line is broken.
- The stop loss is the same for those who held a long position at $65.8K yesterday.
3) $66,577.5 Long position 1st target -> Target prices in the order of Top, Good.
* If the price at the bottom (Section 2, $65,438.8) is touched:
Long position entry point / Stop loss if the green support line is broken. The target price is the same as the one at the top.
- From the point where the green support line is broken,
the Bottom (indicated at the bottom) -> up to Section 3 is open, so
you must exercise caution.
Please use my analysis post only as a reference and for practical application.
I hope you operate safely by strictly adhering to trading principles and stop loss rules.
thank you
การซื้อขายยังคงดำเนินอยู่
Hello.This is the Bitcoin Guide.
Let's check the movements since the analysis post was written on July 22nd.
This is the Bitcoin 30-minute chart.
I have marked the key zones with a black finger.
*On the left, I connected the strategy exactly as it was at the entry point of the long position entered on the 21st, $65,885.8, marked by the purple finger.
Since it touched zone #1 at the top first,
after entering a short position at 66.3K (purple finger #1), it did not break through the pink resistance line.
I switched to a long position at $65,702.1 (light blue finger) at the bottom.
Without breaking the green support line, it rebounded to the pink resistance line and finished.
It is a shame; if it had gone up just a little more, it would have been perfect up to the target price of 66.5K at the top.
There was a round-trip movement of approximately $1,100 up and down.
Overall, it was a sideways market.
With the formation of a new daily candle today, the price moved sideways to the right, breaking the green support line and falling to Zone 2; however, a rebound is currently underway to near 65.7K.
The MACD dead cross has been imprinted on the 4-hour and 6-hour charts. Since the price has been consolidating without significant fluctuations following the initial long entry at 65.8K, I will maintain the long position and proceed with the strategy as active. I will continue with today's strategy.
Thank you.

[Bitcoin Guide Affiliate]
*Bybit 20%DC Lifetime + $30,100
partner.bybit.com/b/Bitcoin_Guide
*BingX 50%DC + $14,100
bit.ly/3E8ZkAW
*ZeroMarket ECN 40%DC
bit.ly/3pY0dUv
*Telegram
t.me/bitcoinguide_TM
*Bybit 20%DC Lifetime + $30,100
partner.bybit.com/b/Bitcoin_Guide
*BingX 50%DC + $14,100
bit.ly/3E8ZkAW
*ZeroMarket ECN 40%DC
bit.ly/3pY0dUv
*Telegram
t.me/bitcoinguide_TM
การนำเสนอที่เกี่ยวข้อง
คำจำกัดสิทธิ์ความรับผิดชอบ
ข้อมูลและบทความไม่ได้มีวัตถุประสงค์เพื่อก่อให้เกิดกิจกรรมทางการเงิน, การลงทุน, การซื้อขาย, ข้อเสนอแนะ หรือคำแนะนำประเภทอื่น ๆ ที่ให้หรือรับรองโดย TradingView อ่านเพิ่มเติมใน ข้อกำหนดการใช้งาน
[Bitcoin Guide Affiliate]
*Bybit 20%DC Lifetime + $30,100
partner.bybit.com/b/Bitcoin_Guide
*BingX 50%DC + $14,100
bit.ly/3E8ZkAW
*ZeroMarket ECN 40%DC
bit.ly/3pY0dUv
*Telegram
t.me/bitcoinguide_TM
*Bybit 20%DC Lifetime + $30,100
partner.bybit.com/b/Bitcoin_Guide
*BingX 50%DC + $14,100
bit.ly/3E8ZkAW
*ZeroMarket ECN 40%DC
bit.ly/3pY0dUv
*Telegram
t.me/bitcoinguide_TM
การนำเสนอที่เกี่ยวข้อง
คำจำกัดสิทธิ์ความรับผิดชอบ
ข้อมูลและบทความไม่ได้มีวัตถุประสงค์เพื่อก่อให้เกิดกิจกรรมทางการเงิน, การลงทุน, การซื้อขาย, ข้อเสนอแนะ หรือคำแนะนำประเภทอื่น ๆ ที่ให้หรือรับรองโดย TradingView อ่านเพิ่มเติมใน ข้อกำหนดการใช้งาน