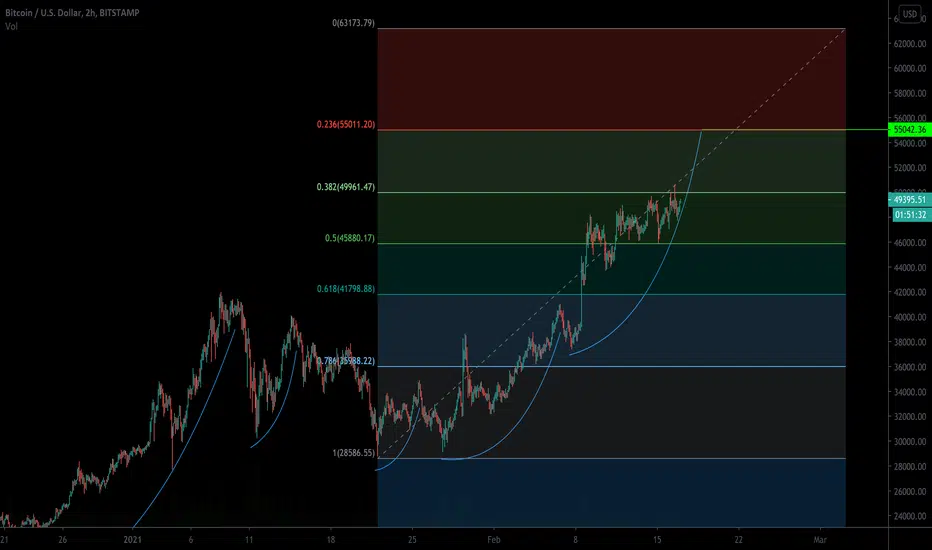
Interesting looking chart for  BTCUSD
On the 4 hour chart the 50 & 100 day moving averages crossed up through the 200 day moving average. I guess you could call this a double golden cross.
If BTC follows along what seems to be a trend that is not yet exhausted based on RSI and MACD, it could hit the .236 fib Retracement level or roughly $55,000
BTCUSD On the 4 hour chart the 50 & 100 day moving averages crossed up through the 200 day moving average. I guess you could call this a double golden cross.
If BTC follows along what seems to be a trend that is not yet exhausted based on RSI and MACD, it could hit the .236 fib Retracement level or roughly $55,000

การนำเสนอที่เกี่ยวข้อง
คำจำกัดสิทธิ์ความรับผิดชอบ
ข้อมูลและบทความไม่ได้มีวัตถุประสงค์เพื่อก่อให้เกิดกิจกรรมทางการเงิน, การลงทุน, การซื้อขาย, ข้อเสนอแนะ หรือคำแนะนำประเภทอื่น ๆ ที่ให้หรือรับรองโดย TradingView อ่านเพิ่มเติมใน ข้อกำหนดการใช้งาน
การนำเสนอที่เกี่ยวข้อง
คำจำกัดสิทธิ์ความรับผิดชอบ
ข้อมูลและบทความไม่ได้มีวัตถุประสงค์เพื่อก่อให้เกิดกิจกรรมทางการเงิน, การลงทุน, การซื้อขาย, ข้อเสนอแนะ หรือคำแนะนำประเภทอื่น ๆ ที่ให้หรือรับรองโดย TradingView อ่านเพิ่มเติมใน ข้อกำหนดการใช้งาน