
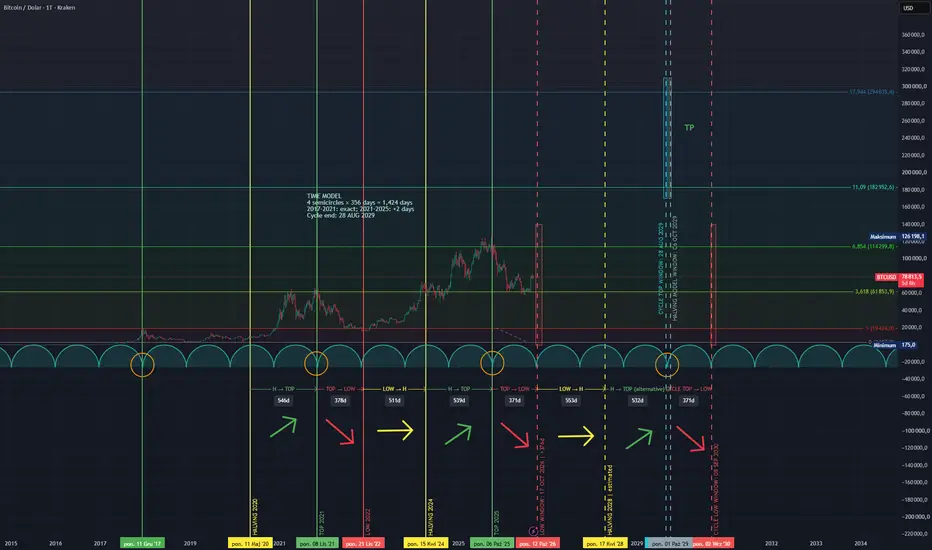
On June 10, 2024, I published the first version of this analysis and marked the time window in which the current Bitcoin cycle was expected to end. More than a year later, BTC reached the projected area almost exactly, close to the final top of the bull market.
The model is based on recurring time cycles represented by equal semicircles. Each segment lasts approximately 356 days, while four segments create a complete 1,424-day cycle between major market tops. The historical anchors from December 2017 and November 2021 align almost perfectly. The 2025 peak differs by only a few days.
Applying the same structure forward gives the next projected major cycle completion around:
August 28, 2029 on the daily chart
September 3, 2029 when displayed on the weekly chart
The difference comes from TradingView assigning drawing anchors to the beginning of weekly candles. It does not represent a different cycle forecast.
I also use Bitcoin’s halving rhythm and Fibonacci relationships as additional confirmation. The halving-based calculation points to October 2029, slightly later than the primary time-cycle projection. This creates a broader period to monitor from late August through early October 2029.
This model primarily forecasts time, not an exact price. Fibonacci extensions provide possible price scenarios, but they should be treated separately from the time-cycle signal.
Markets move through expansion, contraction and repetition. Cycles are never guaranteed to repeat perfectly, but the previous projection was accurate enough for me to continue following this structure.
The next date is already marked. I’m trading accordingly.
The model is based on recurring time cycles represented by equal semicircles. Each segment lasts approximately 356 days, while four segments create a complete 1,424-day cycle between major market tops. The historical anchors from December 2017 and November 2021 align almost perfectly. The 2025 peak differs by only a few days.
Applying the same structure forward gives the next projected major cycle completion around:
August 28, 2029 on the daily chart
September 3, 2029 when displayed on the weekly chart
The difference comes from TradingView assigning drawing anchors to the beginning of weekly candles. It does not represent a different cycle forecast.
I also use Bitcoin’s halving rhythm and Fibonacci relationships as additional confirmation. The halving-based calculation points to October 2029, slightly later than the primary time-cycle projection. This creates a broader period to monitor from late August through early October 2029.
This model primarily forecasts time, not an exact price. Fibonacci extensions provide possible price scenarios, but they should be treated separately from the time-cycle signal.
Markets move through expansion, contraction and repetition. Cycles are never guaranteed to repeat perfectly, but the previous projection was accurate enough for me to continue following this structure.
The next date is already marked. I’m trading accordingly.

การนำเสนอที่เกี่ยวข้อง
คำจำกัดสิทธิ์ความรับผิดชอบ
ข้อมูลและบทความไม่ได้มีวัตถุประสงค์เพื่อก่อให้เกิดกิจกรรมทางการเงิน, การลงทุน, การซื้อขาย, ข้อเสนอแนะ หรือคำแนะนำประเภทอื่น ๆ ที่ให้หรือรับรองโดย TradingView อ่านเพิ่มเติมใน ข้อกำหนดการใช้งาน
การนำเสนอที่เกี่ยวข้อง
คำจำกัดสิทธิ์ความรับผิดชอบ
ข้อมูลและบทความไม่ได้มีวัตถุประสงค์เพื่อก่อให้เกิดกิจกรรมทางการเงิน, การลงทุน, การซื้อขาย, ข้อเสนอแนะ หรือคำแนะนำประเภทอื่น ๆ ที่ให้หรือรับรองโดย TradingView อ่านเพิ่มเติมใน ข้อกำหนดการใช้งาน