📊 BBTC/USDT Market Update – Key Resistance Test & Bullish Pattern
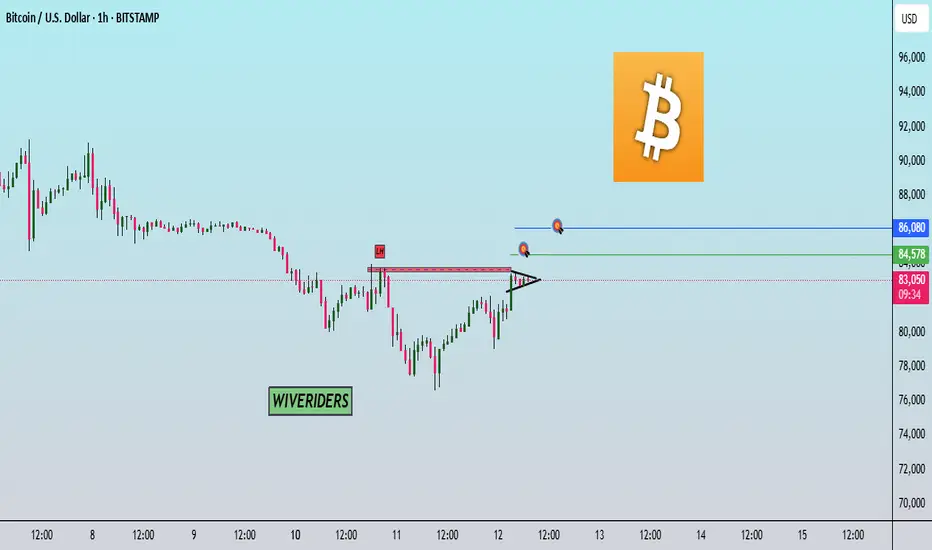
📈 BTC is now testing the red resistance zone, which aligns with the previous Lower High (LH). The price is also forming a bullish pattern, indicating potential breakout momentum.
🔄 If BTC successfully breaks above this resistance:
First target: Green line level.
Second target: Blue line level (previous resistance zone).
📌 Failure to break the red zone may lead to a pullback before another breakout attempt.
📈
BTC is now testing the red resistance zone, which aligns with the previous Lower High (LH). The price is also forming a bullish pattern, indicating potential breakout momentum.🔄 If BTC successfully breaks above this resistance:
First target: Green line level.
Second target: Blue line level (previous resistance zone).
📌 Failure to break the red zone may lead to a pullback before another breakout attempt.

คำจำกัดสิทธิ์ความรับผิดชอบ
ข้อมูลและบทความไม่ได้มีวัตถุประสงค์เพื่อก่อให้เกิดกิจกรรมทางการเงิน, การลงทุน, การซื้อขาย, ข้อเสนอแนะ หรือคำแนะนำประเภทอื่น ๆ ที่ให้หรือรับรองโดย TradingView อ่านเพิ่มเติมใน ข้อกำหนดการใช้งาน
คำจำกัดสิทธิ์ความรับผิดชอบ
ข้อมูลและบทความไม่ได้มีวัตถุประสงค์เพื่อก่อให้เกิดกิจกรรมทางการเงิน, การลงทุน, การซื้อขาย, ข้อเสนอแนะ หรือคำแนะนำประเภทอื่น ๆ ที่ให้หรือรับรองโดย TradingView อ่านเพิ่มเติมใน ข้อกำหนดการใช้งาน