
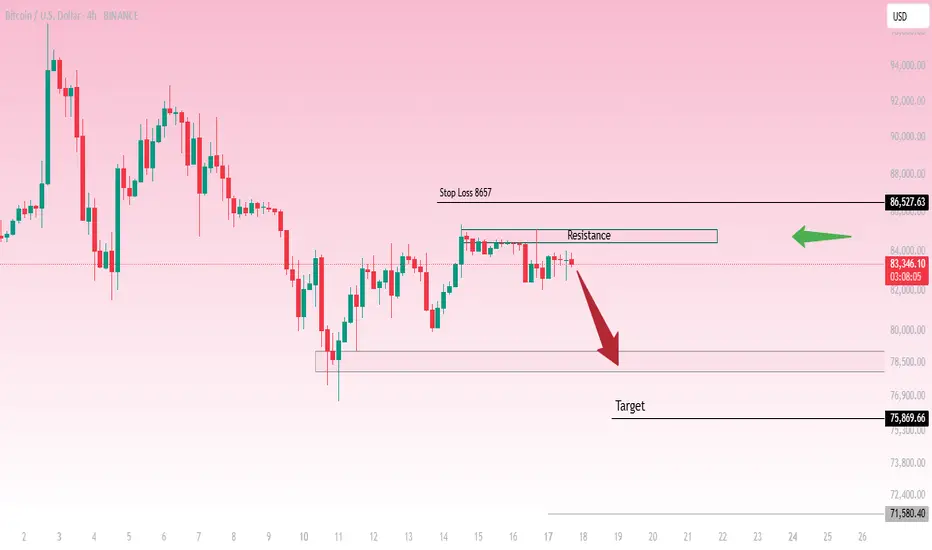
This is a 4-hour chart of Bitcoin (BTC/USD) showing a key resistance level around $86,527 and a potential bearish move towards lower support zones.
Analysis:
Price is currently trading near the resistance zone, struggling to break above it.
A sell setup is suggested, expecting rejection from resistance.
The first target is around $78,500, with an extended downside target at $75,869 and possibly $71,580 if momentum continues.
A stop-loss level is placed above resistance at $86,527, indicating a risk management strategy.
The overall structure suggests bearish sentiment unless price breaks above resistance.
Potential Trading Plan:
📉 Bearish Scenario:
Short below resistance confirmation.
Targets at $78,500, $75,869, and $71,580.
Stop-loss above $86,527.
📈 Bullish Scenario:
A break and close above $86,527 could invalidate the bearish setup.
Analysis:
Price is currently trading near the resistance zone, struggling to break above it.
A sell setup is suggested, expecting rejection from resistance.
The first target is around $78,500, with an extended downside target at $75,869 and possibly $71,580 if momentum continues.
A stop-loss level is placed above resistance at $86,527, indicating a risk management strategy.
The overall structure suggests bearish sentiment unless price breaks above resistance.
Potential Trading Plan:
📉 Bearish Scenario:
Short below resistance confirmation.
Targets at $78,500, $75,869, and $71,580.
Stop-loss above $86,527.
📈 Bullish Scenario:
A break and close above $86,527 could invalidate the bearish setup.

คำจำกัดสิทธิ์ความรับผิดชอบ
ข้อมูลและบทความไม่ได้มีวัตถุประสงค์เพื่อก่อให้เกิดกิจกรรมทางการเงิน, การลงทุน, การซื้อขาย, ข้อเสนอแนะ หรือคำแนะนำประเภทอื่น ๆ ที่ให้หรือรับรองโดย TradingView อ่านเพิ่มเติมใน ข้อกำหนดการใช้งาน
คำจำกัดสิทธิ์ความรับผิดชอบ
ข้อมูลและบทความไม่ได้มีวัตถุประสงค์เพื่อก่อให้เกิดกิจกรรมทางการเงิน, การลงทุน, การซื้อขาย, ข้อเสนอแนะ หรือคำแนะนำประเภทอื่น ๆ ที่ให้หรือรับรองโดย TradingView อ่านเพิ่มเติมใน ข้อกำหนดการใช้งาน