
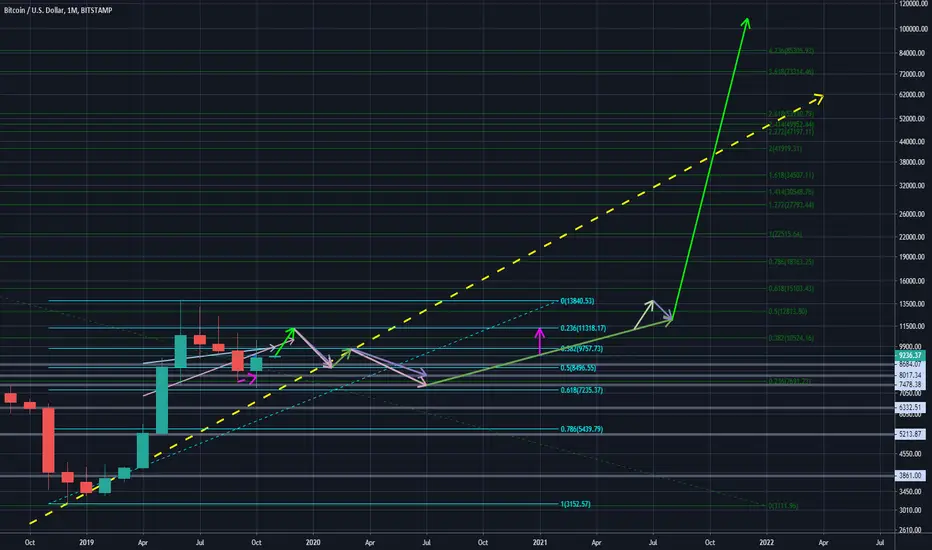
BTC:USD to reach 11k-12k USD, then gradual decline down to 8k USD again around 02Mar20 to inflict more pain on the bulls and eliminating more weak-hands, before going relatively sideways until 13Jul20, then a fakeout to, 11.8k USD around 11Jan21 before crashing below 9.9k USD before the next actual parabolic rise commences around Mar21 eventually hiting a new all-time-high at ~120kUSD.
Base on my earlier speculative post:
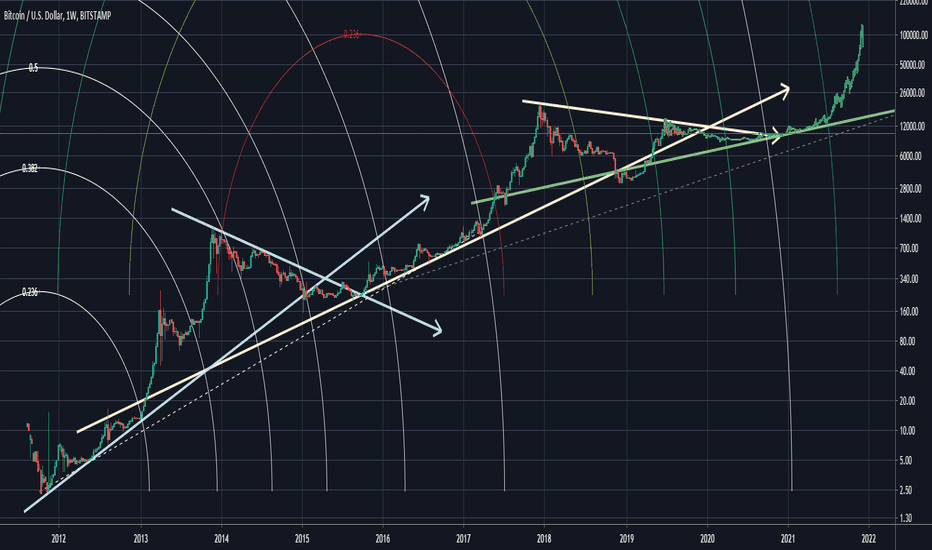
See also shorter term prediction:
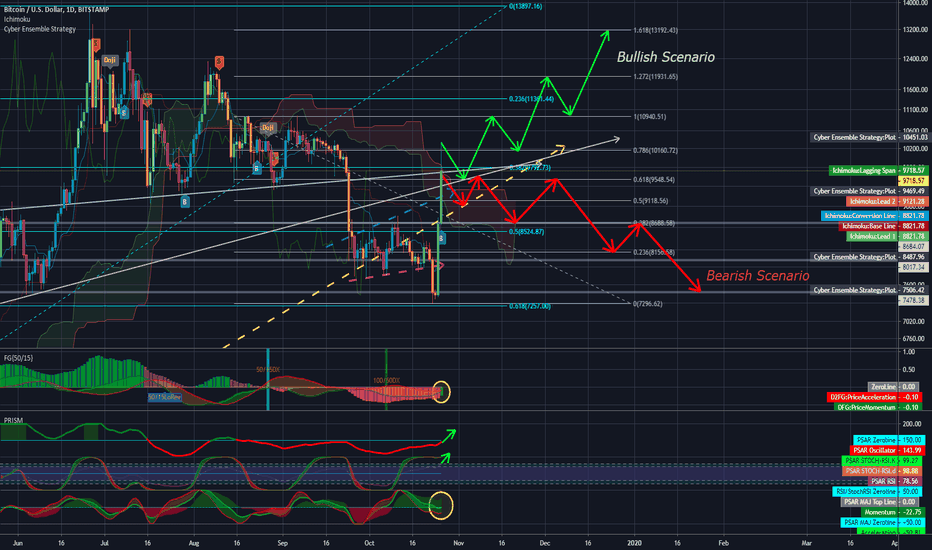
Base on my earlier speculative post:
See also shorter term prediction:

คำจำกัดสิทธิ์ความรับผิดชอบ
ข้อมูลและบทความไม่ได้มีวัตถุประสงค์เพื่อก่อให้เกิดกิจกรรมทางการเงิน, การลงทุน, การซื้อขาย, ข้อเสนอแนะ หรือคำแนะนำประเภทอื่น ๆ ที่ให้หรือรับรองโดย TradingView อ่านเพิ่มเติมใน ข้อกำหนดการใช้งาน
คำจำกัดสิทธิ์ความรับผิดชอบ
ข้อมูลและบทความไม่ได้มีวัตถุประสงค์เพื่อก่อให้เกิดกิจกรรมทางการเงิน, การลงทุน, การซื้อขาย, ข้อเสนอแนะ หรือคำแนะนำประเภทอื่น ๆ ที่ให้หรือรับรองโดย TradingView อ่านเพิ่มเติมใน ข้อกำหนดการใช้งาน