
Hi, we saw a great bull🐮 rally after the price was able to broke an important resistance line. what will happen next?
Bitcoin Analyze ( BTCUSDT ) Timeframe Daily⏰
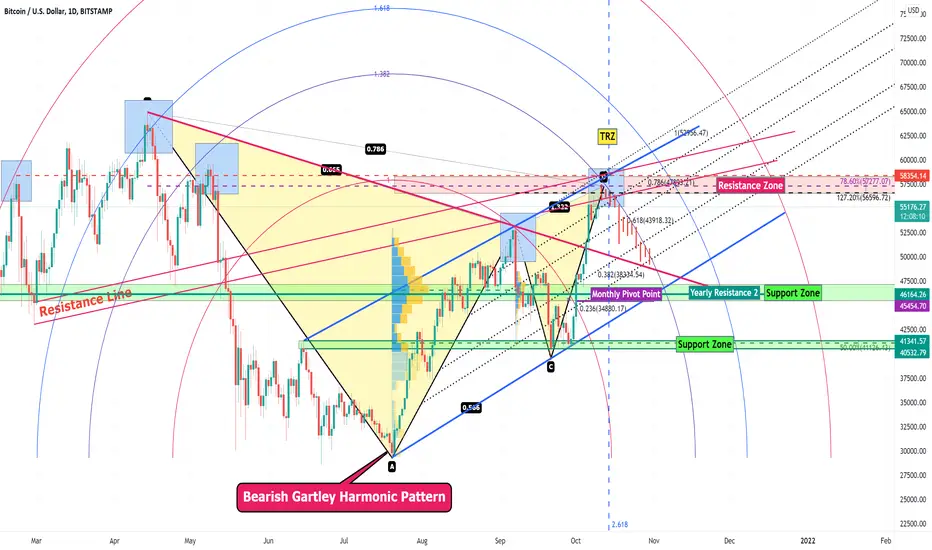
I tried to use some Fib tools for finding the next movement and resistance and support zones on this post. I think that Bitcoin dump again. maybe you are asking why ?! I can see some Signs of Reversal. let's check these Signs.
🛑Sign 1: if you pay attention to lines of Fib Speed Resistance Arcs, you can see, when the price touched lines for the first time on a rally, the price has started to reversing from them (🟦Blue Rectangles🟦).
now price is close to one of these lines✅
🛑Sign 2🛑: Point D of Bearish Gartley Harmonic Pattern will appear around 57260$ & TRZ ✅
🛑Sign 3🛑: seems, Bitcoin is running in Ascending Channel from 28800$ until now. Now Bitcoin is near the upper line of our Ascending Channel and resistance lines and Fib channel's line (Fib 100%) == probably Bitcoin will react to these lines ✅
🛑Sign 4🛑: we have Divergence (RD-) between Price and MACD until Now✅ 👇
🛑Sign 5🛑: on-chain date: Global open interest is 10.98 billion USD (a little dangerous), probably exchanges will get up and dump 🧐
Resistance zones & Suppot Zones on Bitcoin's way :
Resistance Zone: 57280$ until 56700$
Support Zone 1: 47100$ until 45450$
Support Zone 2: 41340$ until 40530$
My Suggestion: you can follow my Fib tools lines. probably these lines will work and help us👍😉.
Do not forget to put Stop loss for your positions (For every position you want to open).
Please follow your strategy, this is just my idea, and I will be glad to see your ideas in this post.
Please do not forget the ✅' like'✅ button 🙏😊 & Share it with your friends, Thanks, and Trade safe
บันทึก
Just a scenario ❗️
Timeframe Daily⏰

🎁 Free Real VIP Forex and Crypto Signals. Please visit:
🔗 t.me/ProTrader_365
🔗 t.me/ProTrader_365
การนำเสนอที่เกี่ยวข้อง
คำจำกัดสิทธิ์ความรับผิดชอบ
ข้อมูลและบทความไม่ได้มีวัตถุประสงค์เพื่อก่อให้เกิดกิจกรรมทางการเงิน, การลงทุน, การซื้อขาย, ข้อเสนอแนะ หรือคำแนะนำประเภทอื่น ๆ ที่ให้หรือรับรองโดย TradingView อ่านเพิ่มเติมใน ข้อกำหนดการใช้งาน