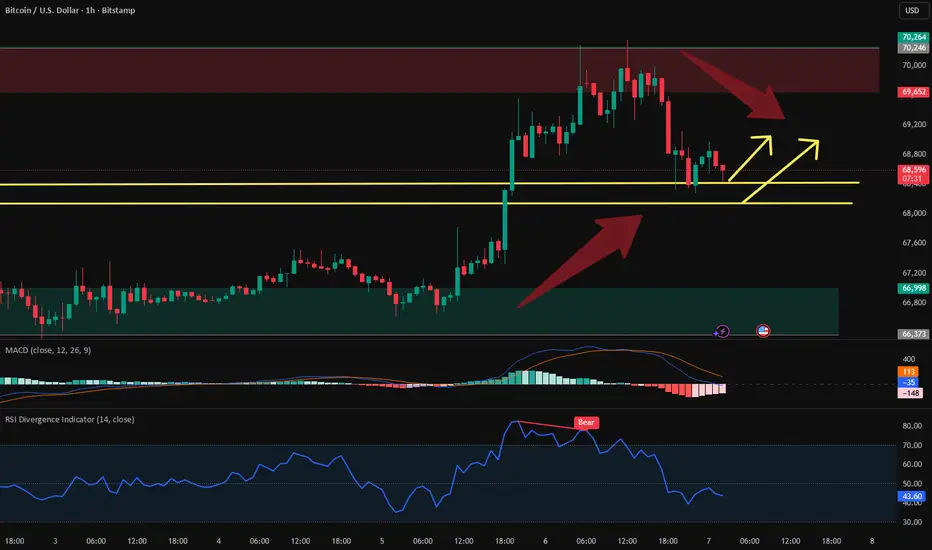
The RSI quickly fell back from the overbought zone to around 50, the MACD histogram continued to decline, the upward momentum gradually contracted, and the bears launched a counterattack. The 4-hour moving averages are in a bearish alignment, the price is trading below the middle band, the MACD has formed a death cross, and the bearish momentum continues to increase. The price broke below the EMA7 and EMA30 moving averages with increased volume and is currently under pressure around $69,000.
For now, a range trading strategy can continue: In the short term, focus on buying low and selling high within the $68,000-$70,000 range. A breakout above $70,500 requires confirmation with increased volume before considering further long positions. If the price falls below $68,000, observe the support level in the $66,000-$67,000 area.
 BTCUSD BTC1! BTCUSD BTCUSD BTCUSD
For now, a range trading strategy can continue: In the short term, focus on buying low and selling high within the $68,000-$70,000 range. A breakout above $70,500 requires confirmation with increased volume before considering further long positions. If the price falls below $68,000, observe the support level in the $66,000-$67,000 area.
BTCUSD BTC1! BTCUSD BTCUSD BTCUSD 
คำจำกัดสิทธิ์ความรับผิดชอบ
ข้อมูลและบทความไม่ได้มีวัตถุประสงค์เพื่อก่อให้เกิดกิจกรรมทางการเงิน, การลงทุน, การซื้อขาย, ข้อเสนอแนะ หรือคำแนะนำประเภทอื่น ๆ ที่ให้หรือรับรองโดย TradingView อ่านเพิ่มเติมใน ข้อกำหนดการใช้งาน
คำจำกัดสิทธิ์ความรับผิดชอบ
ข้อมูลและบทความไม่ได้มีวัตถุประสงค์เพื่อก่อให้เกิดกิจกรรมทางการเงิน, การลงทุน, การซื้อขาย, ข้อเสนอแนะ หรือคำแนะนำประเภทอื่น ๆ ที่ให้หรือรับรองโดย TradingView อ่านเพิ่มเติมใน ข้อกำหนดการใช้งาน