
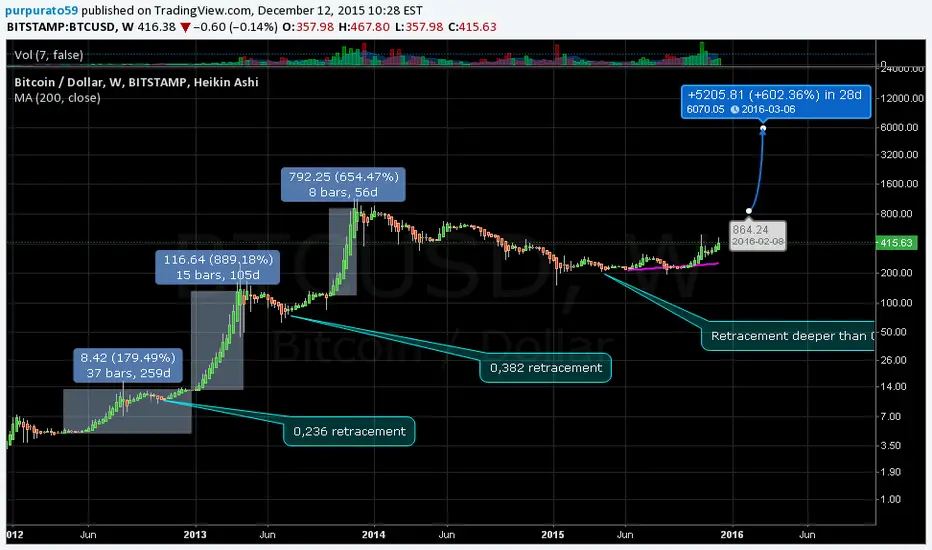
I just traced this using a log scale and Heiken Ashi candles. My purpose was to make an analysis of the great bull runs in bitcoin history. What I see
- Each succesive bullrun has started after the price stabilized on the previous peak.
- Every bullrun has been shorter than the previous one, around half the time.
- Retracements have been deeper everytime
Conclusions on the next bullrun:
- It will come after the price has stabilized around 1000
- It will be shorter than the previous one, something like a month
- It will be the same size in log terms, that is, it will go up to 5000
- It will retrace even harder, that is maybe even full retrace, back to 1000. The price seems to be less stable everytime.
- Each succesive bullrun has started after the price stabilized on the previous peak.
- Every bullrun has been shorter than the previous one, around half the time.
- Retracements have been deeper everytime
Conclusions on the next bullrun:
- It will come after the price has stabilized around 1000
- It will be shorter than the previous one, something like a month
- It will be the same size in log terms, that is, it will go up to 5000
- It will retrace even harder, that is maybe even full retrace, back to 1000. The price seems to be less stable everytime.

คำจำกัดสิทธิ์ความรับผิดชอบ
ข้อมูลและบทความไม่ได้มีวัตถุประสงค์เพื่อก่อให้เกิดกิจกรรมทางการเงิน, การลงทุน, การซื้อขาย, ข้อเสนอแนะ หรือคำแนะนำประเภทอื่น ๆ ที่ให้หรือรับรองโดย TradingView อ่านเพิ่มเติมใน ข้อกำหนดการใช้งาน
คำจำกัดสิทธิ์ความรับผิดชอบ
ข้อมูลและบทความไม่ได้มีวัตถุประสงค์เพื่อก่อให้เกิดกิจกรรมทางการเงิน, การลงทุน, การซื้อขาย, ข้อเสนอแนะ หรือคำแนะนำประเภทอื่น ๆ ที่ให้หรือรับรองโดย TradingView อ่านเพิ่มเติมใน ข้อกำหนดการใช้งาน