
Hellow tradingview,
- After almost 1 whole year of trading inside a descending triangle we finally broke out to the downside and hit the 3000$ target with near perfection.
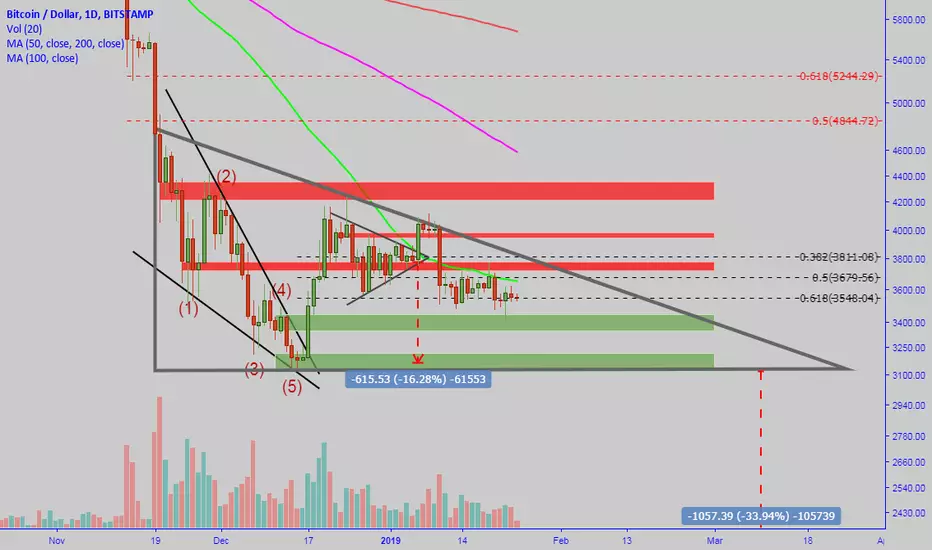
- Now we can see on the chart above Bitcoin could potential form a new descending triangle.
- After a weak correction to the upper side we topped out at 4245$, we formed a bullish pattern and broke out of it. But selling pressure was so high wich resulted in a big drop once again. At this time i am looking for a double bottom around 3150$ more or less.
- I want to point out that the pattern is still not active YET, if we touch the lower trend-line again which is very likely, the pattern becomes active.
- Quick measurement shows us that a target of 2000$ is very possible for Bitcoin
- Pattern becomes invalid if we break above the upper trendline or break below it.
Safe trading!
- After almost 1 whole year of trading inside a descending triangle we finally broke out to the downside and hit the 3000$ target with near perfection.
- Now we can see on the chart above Bitcoin could potential form a new descending triangle.
- After a weak correction to the upper side we topped out at 4245$, we formed a bullish pattern and broke out of it. But selling pressure was so high wich resulted in a big drop once again. At this time i am looking for a double bottom around 3150$ more or less.
- I want to point out that the pattern is still not active YET, if we touch the lower trend-line again which is very likely, the pattern becomes active.
- Quick measurement shows us that a target of 2000$ is very possible for Bitcoin
- Pattern becomes invalid if we break above the upper trendline or break below it.
Safe trading!
ออร์เดอร์ถูกยกเลิก

คำจำกัดสิทธิ์ความรับผิดชอบ
ข้อมูลและบทความไม่ได้มีวัตถุประสงค์เพื่อก่อให้เกิดกิจกรรมทางการเงิน, การลงทุน, การซื้อขาย, ข้อเสนอแนะ หรือคำแนะนำประเภทอื่น ๆ ที่ให้หรือรับรองโดย TradingView อ่านเพิ่มเติมใน ข้อกำหนดการใช้งาน
คำจำกัดสิทธิ์ความรับผิดชอบ
ข้อมูลและบทความไม่ได้มีวัตถุประสงค์เพื่อก่อให้เกิดกิจกรรมทางการเงิน, การลงทุน, การซื้อขาย, ข้อเสนอแนะ หรือคำแนะนำประเภทอื่น ๆ ที่ให้หรือรับรองโดย TradingView อ่านเพิ่มเติมใน ข้อกำหนดการใช้งาน