
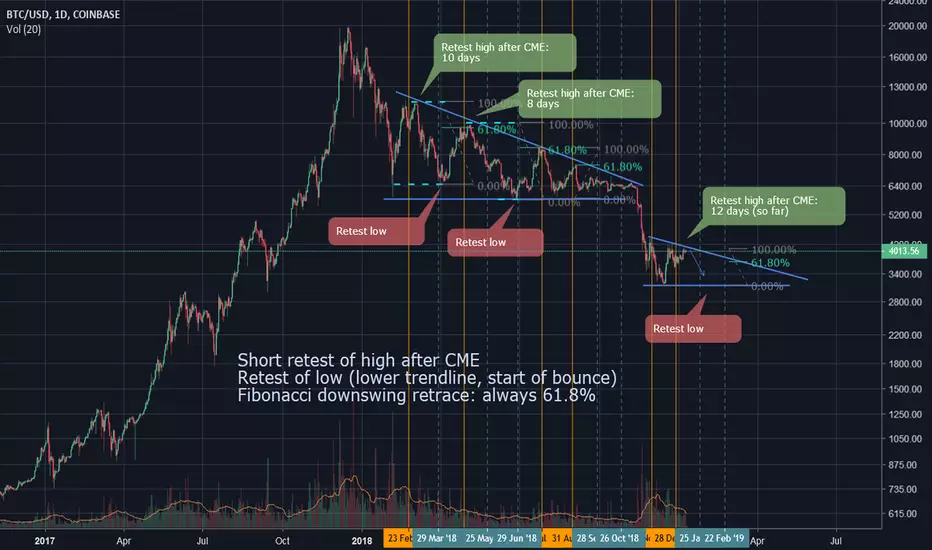
Continuing from my previous chart. Fibonacci downswing retrace is always 61.8%
- All vertical lines are the CME Bitcoin Futures expiry dates
- Each orange vertical line, shows a CME date that was preceded by a bounce
- Following those dates (orange), there is a short retest of the recent high
- The price then drops all the way back down to test the start of that bounce
- After testing the lower trendline, the downswing Fibonacci retrace is always 61.8% (to meet the upper trendline)
- This cycle repeats until the price breaks down to a lower plateau trendline

การนำเสนอที่เกี่ยวข้อง
คำจำกัดสิทธิ์ความรับผิดชอบ
ข้อมูลและบทความไม่ได้มีวัตถุประสงค์เพื่อก่อให้เกิดกิจกรรมทางการเงิน, การลงทุน, การซื้อขาย, ข้อเสนอแนะ หรือคำแนะนำประเภทอื่น ๆ ที่ให้หรือรับรองโดย TradingView อ่านเพิ่มเติมใน ข้อกำหนดการใช้งาน
การนำเสนอที่เกี่ยวข้อง
คำจำกัดสิทธิ์ความรับผิดชอบ
ข้อมูลและบทความไม่ได้มีวัตถุประสงค์เพื่อก่อให้เกิดกิจกรรมทางการเงิน, การลงทุน, การซื้อขาย, ข้อเสนอแนะ หรือคำแนะนำประเภทอื่น ๆ ที่ให้หรือรับรองโดย TradingView อ่านเพิ่มเติมใน ข้อกำหนดการใช้งาน