
Lower-timeframe, might signal contrary to bigger reversal than the 'continuation' uptrend.
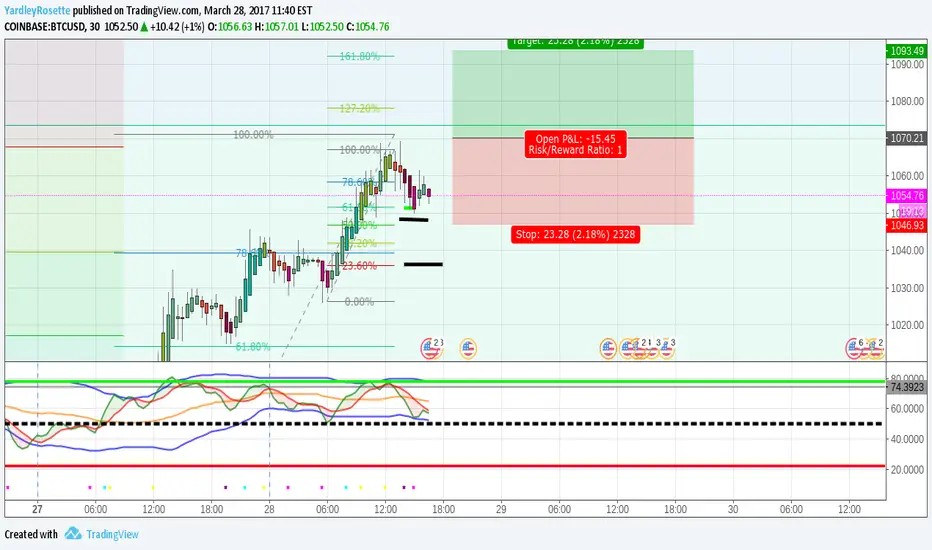
2-Hour chart signals a soon possible downward [SHORT] reversal. Contrary to posted idea [See IMAGE below]
I set a Fibonacci within a major Fibonacci retracement and found this "u-turn". Assuming Market Baseline (Yellow) will continue to show an uptrend.
Even though, this may be the last chance for the price to move down [short] as shown in snapshot image, if it becomes a reversal.
2-Hour chart signals a soon possible downward [SHORT] reversal. Contrary to posted idea [See IMAGE below]
I set a Fibonacci within a major Fibonacci retracement and found this "u-turn". Assuming Market Baseline (Yellow) will continue to show an uptrend.
Even though, this may be the last chance for the price to move down [short] as shown in snapshot image, if it becomes a reversal.
บันทึก
Price hit 61.8% of past Fibonacci retracement tool placed, if it will continue up, it will rise to at least $1,110.การซื้อขายยังคงดำเนินอยู่
$1070 Buy Stop entryปิดการเทรด: ถึงเป้าหมายการทำกำไร
$1092 trade close
การนำเสนอที่เกี่ยวข้อง
คำจำกัดสิทธิ์ความรับผิดชอบ
ข้อมูลและบทความไม่ได้มีวัตถุประสงค์เพื่อก่อให้เกิดกิจกรรมทางการเงิน, การลงทุน, การซื้อขาย, ข้อเสนอแนะ หรือคำแนะนำประเภทอื่น ๆ ที่ให้หรือรับรองโดย TradingView อ่านเพิ่มเติมใน ข้อกำหนดการใช้งาน
การนำเสนอที่เกี่ยวข้อง
คำจำกัดสิทธิ์ความรับผิดชอบ
ข้อมูลและบทความไม่ได้มีวัตถุประสงค์เพื่อก่อให้เกิดกิจกรรมทางการเงิน, การลงทุน, การซื้อขาย, ข้อเสนอแนะ หรือคำแนะนำประเภทอื่น ๆ ที่ให้หรือรับรองโดย TradingView อ่านเพิ่มเติมใน ข้อกำหนดการใช้งาน