
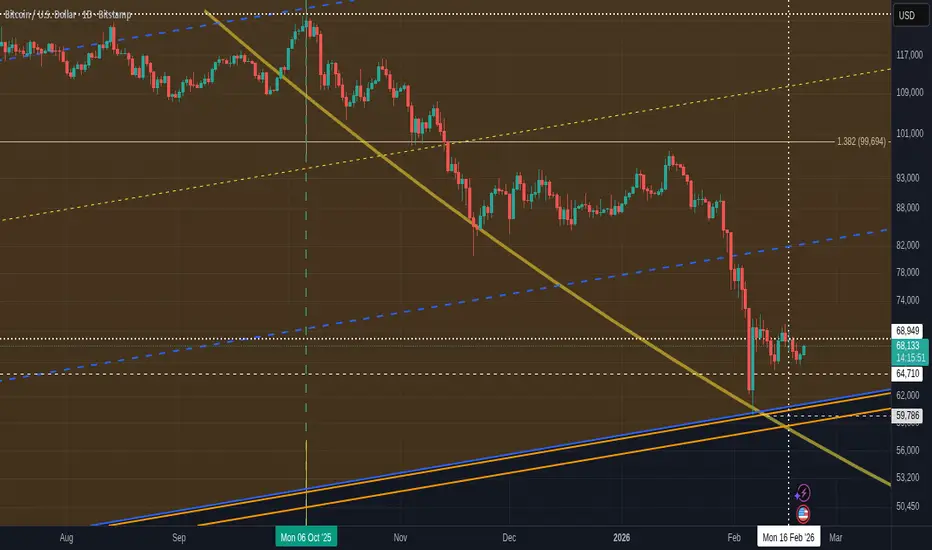
For me, it is THIS Chart that really gives us an idea of where BTC PA is in relation to a Bottom.
This completely depends on Bitcoin remaining in its usual patterns......Which it may not be but we will not know until it changes, IF it Happens.
So, the main chatrt shows us a part of the Bigger picture below.
Bitcoin in its Next Cup, which it has reached the Bottom zone of. There is room for a further dip down to the real true base line at around 59780 area.
This chart shows us the Channel that PA may continue to range in, from 64K up to around 69K top
Should PA fall out of this Range, we have rising lines of support lines here arounf 60K to 63K
Technically strong.
Here is another Weekly chart
This gives us another Range Box, with a low arounf 58500 on the cycle 3 Fib extension.
We could see a Wick down to around the 58K line but I am certain this would be a swift recovery
Confluence with the Original chart above.
Again, we see that Range Box with potential lower levels.
This weekly shows us that PA has already Wicked down and bounced off the 200 week SMA.
The 200 week SMA is a traditinal line of support. Currently at around.....58500
Now, the 3rd Set of Charts are the VWAP charts.
Volume-Weighted Average Price (VWAP) is a technical indicator that calculates the average price a security has traded at throughout a specific period—typically a single trading day—weighted by trading volume. It provides a benchmark for assessing fair value and execution quality by giving more importance to prices at which larger volumes were traded.
This is the Monthly VWAP chart with the VWAP origins at the Cycle lows after the previous ATH
VWAP Colors - Light Blue - 2015, White - 2018, Yellow - 2022
The Red lines are Multiples of the various VWAPs and act as strong support . resistance.
See how PA pretty well NEVER Drops below the VWAP
Lets zoom in to the weekly
PA did drop below the VWAP Twice on the 2021 ATH White line VWAP, once on Covid and then after the FTX Crash in 2022. Not normal circumstances.
The Daily VWAP chart and price levels
Key levels are
The Current Cycle VWAP is 63522 usd and for Me, I am seeing THAT as the floor line..... the absolute level under normal circumstances should the support levels above break.
Again, in the same tight price range as the other charts above..
Confluence is Vital.
Should we see an extraordinary MACRO incident, we have levels of support below, initially at 57K and 55K.
It is always a Very Good idea to understand the potential for a lower drop than expected and with this in mind, we should see the lower VWAP lines too
40600 in the 1.236 Fib extension
35K and 27K on the VWAP
But the Real test for me, that I am watching VERY closely is back on the Original chart
It is VERY Simple.
WILL PA REMAIN IN THE LONG TERM ASCENDING CHANNEL OR WILL IT DROP OUT AND SHOW US THAT CYCLE DYNAMICS HAVE CHANGED.
Time will tell

Nothing to be taken as Financial advice.
I will always say
"Only invest what you can afford to loose. When you are ready, take out your original investment. This way, it is only your profit that is at risk"
THAT is Financial advice
I will always say
"Only invest what you can afford to loose. When you are ready, take out your original investment. This way, it is only your profit that is at risk"
THAT is Financial advice
คำจำกัดสิทธิ์ความรับผิดชอบ
ข้อมูลและบทความไม่ได้มีวัตถุประสงค์เพื่อก่อให้เกิดกิจกรรมทางการเงิน, การลงทุน, การซื้อขาย, ข้อเสนอแนะ หรือคำแนะนำประเภทอื่น ๆ ที่ให้หรือรับรองโดย TradingView อ่านเพิ่มเติมใน ข้อกำหนดการใช้งาน
Nothing to be taken as Financial advice.
I will always say
"Only invest what you can afford to loose. When you are ready, take out your original investment. This way, it is only your profit that is at risk"
THAT is Financial advice
I will always say
"Only invest what you can afford to loose. When you are ready, take out your original investment. This way, it is only your profit that is at risk"
THAT is Financial advice
คำจำกัดสิทธิ์ความรับผิดชอบ
ข้อมูลและบทความไม่ได้มีวัตถุประสงค์เพื่อก่อให้เกิดกิจกรรมทางการเงิน, การลงทุน, การซื้อขาย, ข้อเสนอแนะ หรือคำแนะนำประเภทอื่น ๆ ที่ให้หรือรับรองโดย TradingView อ่านเพิ่มเติมใน ข้อกำหนดการใช้งาน