
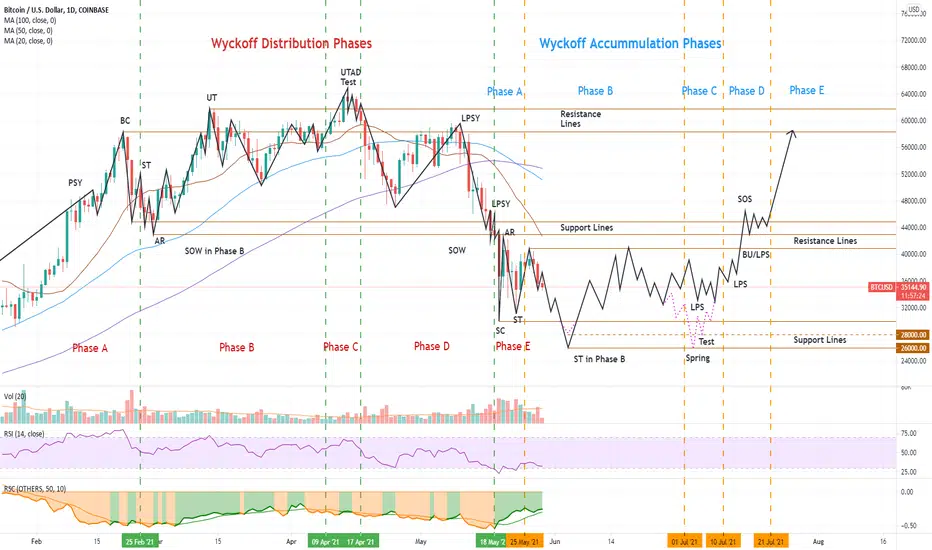
In this study, I have overlayed the Wyckoff Distribution phases over the Bitcoin chart, and project a recovery with the Wyckoff Accumulation phases.
I acknowledge the work done by YouTube user "uncomplication" in his published video on Wyckoff Distribution. See his video here: https://www.youtube.com/watch?v=Lhf_2gJJS1I&t=373s
For insight into what the abbreviations signify and what the Wyckoff Cycle is about, you may like to review https://www.wyckoffanalytics.com/wyckoff-method/.
I acknowledge the work done by YouTube user "uncomplication" in his published video on Wyckoff Distribution. See his video here: https://www.youtube.com/watch?v=Lhf_2gJJS1I&t=373s
For insight into what the abbreviations signify and what the Wyckoff Cycle is about, you may like to review https://www.wyckoffanalytics.com/wyckoff-method/.
บันทึก
Just an update following the developments of the past few days:Looks like it's on track.
บันทึก
Well we've seen a green candle today. But still within the bounds of error for the resistance line. Here I've added a dotted line to highlight the resistance across the upper wicks of the green candles within this trading range. If it is going to fall, we are knocking on the door. It will either break upwards and rally hard, or Mr. Wyckoff will be right and Goldman Sachs are running the show now.

การนำเสนอที่เกี่ยวข้อง
คำจำกัดสิทธิ์ความรับผิดชอบ
ข้อมูลและบทความไม่ได้มีวัตถุประสงค์เพื่อก่อให้เกิดกิจกรรมทางการเงิน, การลงทุน, การซื้อขาย, ข้อเสนอแนะ หรือคำแนะนำประเภทอื่น ๆ ที่ให้หรือรับรองโดย TradingView อ่านเพิ่มเติมใน ข้อกำหนดการใช้งาน
การนำเสนอที่เกี่ยวข้อง
คำจำกัดสิทธิ์ความรับผิดชอบ
ข้อมูลและบทความไม่ได้มีวัตถุประสงค์เพื่อก่อให้เกิดกิจกรรมทางการเงิน, การลงทุน, การซื้อขาย, ข้อเสนอแนะ หรือคำแนะนำประเภทอื่น ๆ ที่ให้หรือรับรองโดย TradingView อ่านเพิ่มเติมใน ข้อกำหนดการใช้งาน