
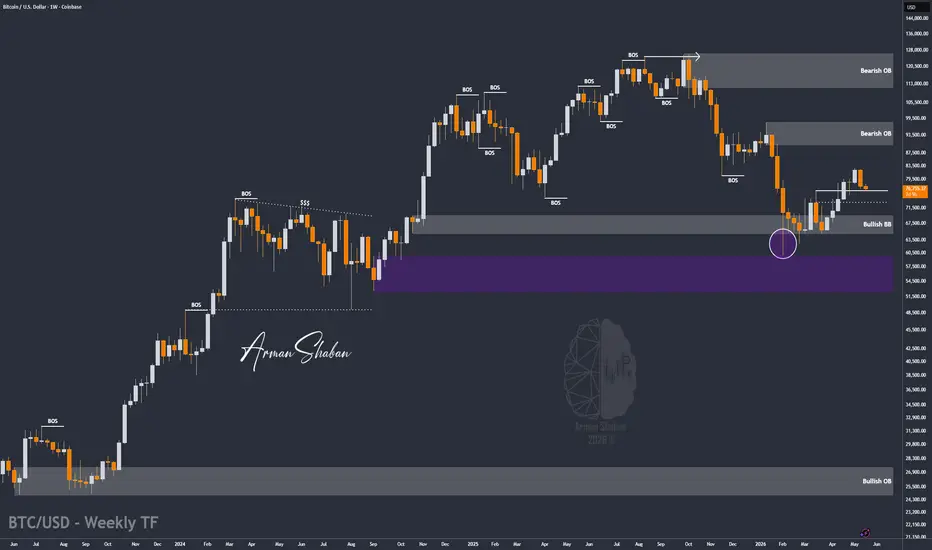
By analyzing the #Bitcoin chart on the weekly timeframe, we can see that after the previous update where BTC was trading around the $75K region, price successfully pushed higher and rallied all the way toward $83K before entering a corrective phase.
Currently, Bitcoin is trading around the $76,700 region and the $73K – $77K zone remains a very important demand and accumulation area. As long as price manages to stabilize above this key support cluster, the broader bullish structure remains fully valid.
From a structural perspective, the nearest demand zones are located around $73K – $77K, with deeper structural support sitting near $69.5K – $71K. On the upside, the closest supply zones are forming around $82K – $85K, followed by the stronger resistance cluster between $88K – $92K.
If buyers defend this demand zone and momentum starts building again, the next upside targets to monitor are $82K, followed by $85K, then $88K, and potentially $92K if bullish momentum accelerates across the broader crypto market.
Right now, this correction still looks like a healthy pullback inside a larger bullish trend rather than a full bearish reversal.
Please support me with your likes and comments to motivate me to share more analysis with you and share your opinion about the possible trend of this chart with me !
Best Regards , Arman Shaban
Currently, Bitcoin is trading around the $76,700 region and the $73K – $77K zone remains a very important demand and accumulation area. As long as price manages to stabilize above this key support cluster, the broader bullish structure remains fully valid.
From a structural perspective, the nearest demand zones are located around $73K – $77K, with deeper structural support sitting near $69.5K – $71K. On the upside, the closest supply zones are forming around $82K – $85K, followed by the stronger resistance cluster between $88K – $92K.
If buyers defend this demand zone and momentum starts building again, the next upside targets to monitor are $82K, followed by $85K, then $88K, and potentially $92K if bullish momentum accelerates across the broader crypto market.
Right now, this correction still looks like a healthy pullback inside a larger bullish trend rather than a full bearish reversal.
Please support me with your likes and comments to motivate me to share more analysis with you and share your opinion about the possible trend of this chart with me !
Best Regards , Arman Shaban

📘 Wanna Learn ICT & SMC? Get the Full Book Here : bit.ly/ICT-BOOK
⚜️ Free Telegram Channel : telegram.me/PriceAction_ICT
⚜️ JOIN THE VIP 👉 t.me/ArmanShabanTrading
🚀 MondFX — our trusted Broker : bit.ly/MondFx
⚜️ Free Telegram Channel : telegram.me/PriceAction_ICT
⚜️ JOIN THE VIP 👉 t.me/ArmanShabanTrading
🚀 MondFX — our trusted Broker : bit.ly/MondFx
การนำเสนอที่เกี่ยวข้อง
คำจำกัดสิทธิ์ความรับผิดชอบ
ข้อมูลและบทความไม่ได้มีวัตถุประสงค์เพื่อก่อให้เกิดกิจกรรมทางการเงิน, การลงทุน, การซื้อขาย, ข้อเสนอแนะ หรือคำแนะนำประเภทอื่น ๆ ที่ให้หรือรับรองโดย TradingView อ่านเพิ่มเติมใน ข้อกำหนดการใช้งาน
📘 Wanna Learn ICT & SMC? Get the Full Book Here : bit.ly/ICT-BOOK
⚜️ Free Telegram Channel : telegram.me/PriceAction_ICT
⚜️ JOIN THE VIP 👉 t.me/ArmanShabanTrading
🚀 MondFX — our trusted Broker : bit.ly/MondFx
⚜️ Free Telegram Channel : telegram.me/PriceAction_ICT
⚜️ JOIN THE VIP 👉 t.me/ArmanShabanTrading
🚀 MondFX — our trusted Broker : bit.ly/MondFx
การนำเสนอที่เกี่ยวข้อง
คำจำกัดสิทธิ์ความรับผิดชอบ
ข้อมูลและบทความไม่ได้มีวัตถุประสงค์เพื่อก่อให้เกิดกิจกรรมทางการเงิน, การลงทุน, การซื้อขาย, ข้อเสนอแนะ หรือคำแนะนำประเภทอื่น ๆ ที่ให้หรือรับรองโดย TradingView อ่านเพิ่มเติมใน ข้อกำหนดการใช้งาน