
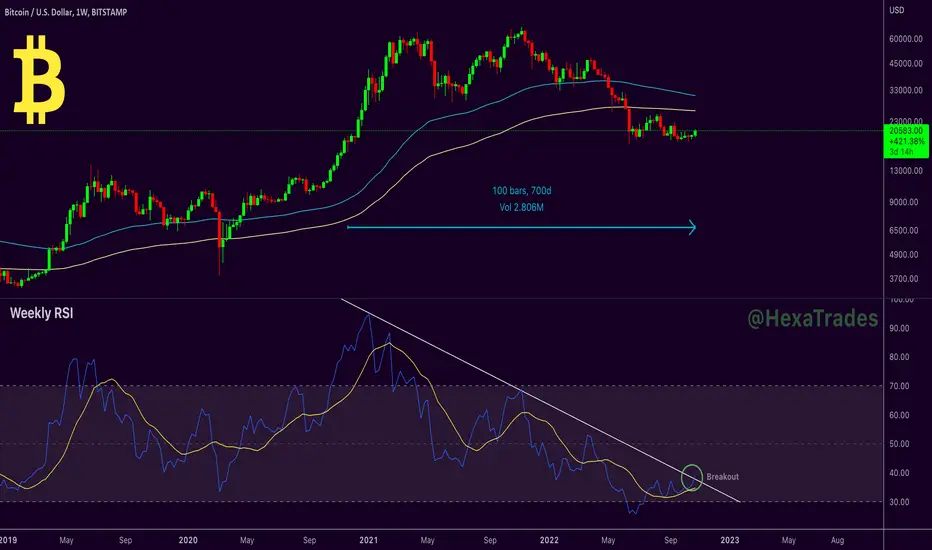
Bitcoin technical analysis update (Weekly Chart)
Bitcoin's weekly RSI falling from the last 2 years, In December 2020 weekly RSI touched 95 overbought levels, at the time BTC was trading at $42000 after that RSI started falling.
In the above chart, you can see Bitcoin 2 year-long Weekly RSI breakout above its trend resistance line, this is a good bullish sign for bitcoin.
Thanks
Hexa
Bitcoin's weekly RSI falling from the last 2 years, In December 2020 weekly RSI touched 95 overbought levels, at the time BTC was trading at $42000 after that RSI started falling.
In the above chart, you can see Bitcoin 2 year-long Weekly RSI breakout above its trend resistance line, this is a good bullish sign for bitcoin.
Thanks
Hexa
บันทึก
Chart Update
🚀Telegram : t.me/hexatrades
🌐Website: hexatrades.io/
🗣️Twitter(X): twitter.com/HexaTrades
🌐Website: hexatrades.io/
🗣️Twitter(X): twitter.com/HexaTrades
การนำเสนอที่เกี่ยวข้อง
คำจำกัดสิทธิ์ความรับผิดชอบ
ข้อมูลและบทความไม่ได้มีวัตถุประสงค์เพื่อก่อให้เกิดกิจกรรมทางการเงิน, การลงทุน, การซื้อขาย, ข้อเสนอแนะ หรือคำแนะนำประเภทอื่น ๆ ที่ให้หรือรับรองโดย TradingView อ่านเพิ่มเติมใน ข้อกำหนดการใช้งาน
🚀Telegram : t.me/hexatrades
🌐Website: hexatrades.io/
🗣️Twitter(X): twitter.com/HexaTrades
🌐Website: hexatrades.io/
🗣️Twitter(X): twitter.com/HexaTrades
การนำเสนอที่เกี่ยวข้อง
คำจำกัดสิทธิ์ความรับผิดชอบ
ข้อมูลและบทความไม่ได้มีวัตถุประสงค์เพื่อก่อให้เกิดกิจกรรมทางการเงิน, การลงทุน, การซื้อขาย, ข้อเสนอแนะ หรือคำแนะนำประเภทอื่น ๆ ที่ให้หรือรับรองโดย TradingView อ่านเพิ่มเติมใน ข้อกำหนดการใช้งาน