
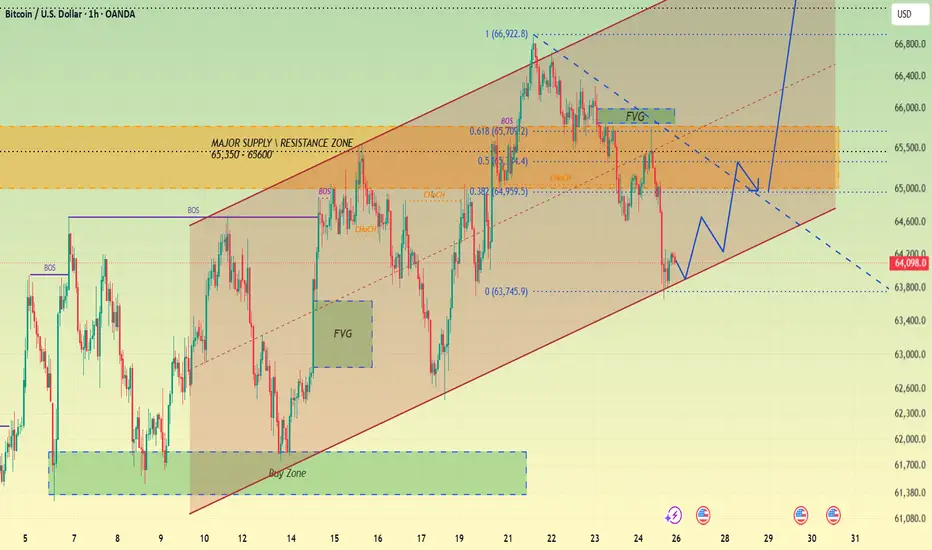
The 1H BTCUSD chart shows Bitcoin trading within a well-defined ascending channel that has guided price action for the past two weeks. After a strong impulsive rally that pushed price to a high of 66,922.8, aligning with the 1.0 Fibonacci extension, the market entered a corrective phase, retracing through key levels including the 0.618 (65,709) and 0.5 (65,354) marks.
This pullback was confirmed by a CHoCH (Change of Character) signal, indicating weakening bullish momentum after the rejection near the Major Supply/Resistance Zone (65,350–65,600) — a level that has repeatedly capped upside attempts throughout July.
Currently trading at 64,098.0, down 0.11% on the session, price has dropped to the lower boundary of the ascending channel, an area that has historically provided strong support during this trend. This channel structure, combined with the 0 Fibonacci level near 63,746, creates a zone of confluence where buyers may look to step back in.
The projected path suggests a stepped recovery is possible from this channel support, with price potentially working through a minor pullback before attempting to reclaim the Major Supply Zone and push toward a breakout above the channel's upper boundary, targeting fresh highs beyond 66,922.8.
From a risk management perspective, the key invalidation level is a decisive break below the channel's lower trend line (under 63,745). Such a move would suggest the ascending channel structure has broken down and could open the door for a deeper retracement toward the Buy Zone near 61,380–62,000.
For now, structure favors a bounce from channel support, with traders watching for confirmation before targeting a breakout above the supply zone.
Do you think Bitcoin will hold channel support and break higher, or will we see a deeper pullback toward the Buy Zone first?
This pullback was confirmed by a CHoCH (Change of Character) signal, indicating weakening bullish momentum after the rejection near the Major Supply/Resistance Zone (65,350–65,600) — a level that has repeatedly capped upside attempts throughout July.
Currently trading at 64,098.0, down 0.11% on the session, price has dropped to the lower boundary of the ascending channel, an area that has historically provided strong support during this trend. This channel structure, combined with the 0 Fibonacci level near 63,746, creates a zone of confluence where buyers may look to step back in.
The projected path suggests a stepped recovery is possible from this channel support, with price potentially working through a minor pullback before attempting to reclaim the Major Supply Zone and push toward a breakout above the channel's upper boundary, targeting fresh highs beyond 66,922.8.
From a risk management perspective, the key invalidation level is a decisive break below the channel's lower trend line (under 63,745). Such a move would suggest the ascending channel structure has broken down and could open the door for a deeper retracement toward the Buy Zone near 61,380–62,000.
For now, structure favors a bounce from channel support, with traders watching for confirmation before targeting a breakout above the supply zone.
Do you think Bitcoin will hold channel support and break higher, or will we see a deeper pullback toward the Buy Zone first?
การซื้อขายยังคงดำเนินอยู่
Trade active, in profit. Want me to flag it once price confirms a break above 65,600 or a rejection back down?Trading Update – BTCUSD (Active)
📍 Entry (bounce confirmation): 64,074.5
📍 Current price: 65,386.5 (+0.06% on session)
📍 High reached: 65,328.3 (touching resistance zone)
Pips captured so far: 65,386.5 − 64,074.5 = ~1,312 pips
➡️ Price has rallied strongly from the 64,074.5 low and is now testing into the 65,000–65,600 resistance zone, right around the 0.5 Fibonacci retracement level of the prior move.
This is a solid capture already — over 1,300 pips in the bag. Price is now reacting at this key zone, so this is the area to watch closely for either a clean breakout continuation or a pullback/consolidation before the next leg.
บันทึก
BTCUSD 1H Update: Following the recent BOS, price is correcting after rejecting from the major supply zone near 66,900. The projected path favors a retracement into the 0.382–0.5 Fibonacci confluence around 64,950–65,100, where trendline support and nearby liquidity could attract buyers. A successful defense of this area would increase the probability of bullish continuation toward the previous high and potentially new highs. Key level to watch: maintaining structure above 64,900 keeps the bullish bias valid.

🏆 Free Gold Plan: 1 - 3 signals per day
🏆 Vip Gold Scalping: 10 - 15 signals per day
🏆 Vip Gold Swing Trade: 3 - 5 signals per day
🏆 Trading Idea / Setup / Tech
Educational Platform: t.me/+1lrGDIBR1S4yNmRl
🏆 Vip Gold Scalping: 10 - 15 signals per day
🏆 Vip Gold Swing Trade: 3 - 5 signals per day
🏆 Trading Idea / Setup / Tech
Educational Platform: t.me/+1lrGDIBR1S4yNmRl
คำจำกัดสิทธิ์ความรับผิดชอบ
ข้อมูลและบทความไม่ได้มีวัตถุประสงค์เพื่อก่อให้เกิดกิจกรรมทางการเงิน, การลงทุน, การซื้อขาย, ข้อเสนอแนะ หรือคำแนะนำประเภทอื่น ๆ ที่ให้หรือรับรองโดย TradingView อ่านเพิ่มเติมใน ข้อกำหนดการใช้งาน
🏆 Free Gold Plan: 1 - 3 signals per day
🏆 Vip Gold Scalping: 10 - 15 signals per day
🏆 Vip Gold Swing Trade: 3 - 5 signals per day
🏆 Trading Idea / Setup / Tech
Educational Platform: t.me/+1lrGDIBR1S4yNmRl
🏆 Vip Gold Scalping: 10 - 15 signals per day
🏆 Vip Gold Swing Trade: 3 - 5 signals per day
🏆 Trading Idea / Setup / Tech
Educational Platform: t.me/+1lrGDIBR1S4yNmRl
คำจำกัดสิทธิ์ความรับผิดชอบ
ข้อมูลและบทความไม่ได้มีวัตถุประสงค์เพื่อก่อให้เกิดกิจกรรมทางการเงิน, การลงทุน, การซื้อขาย, ข้อเสนอแนะ หรือคำแนะนำประเภทอื่น ๆ ที่ให้หรือรับรองโดย TradingView อ่านเพิ่มเติมใน ข้อกำหนดการใช้งาน