
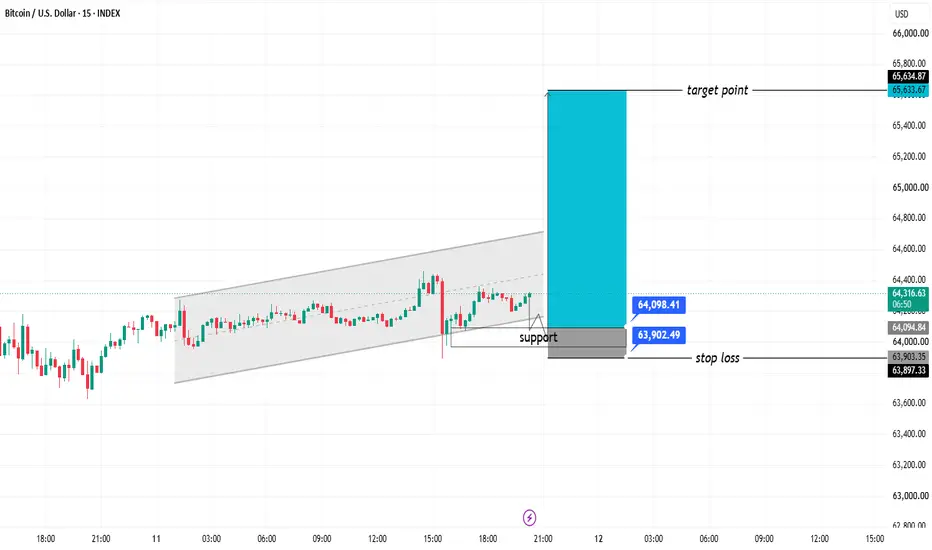
BTC/USD 15M Analysis
Market Structure
Timeframe: 15 Minutes
Current Price: around 64,309.
Price has been trading inside an ascending channel.
A strong rejection wick occurred near the lower boundary, followed by a recovery.
The chart highlights a support zone around 64,100–63,900, suggesting buyers are defending this area.
Bullish Bias
Higher lows continue to form within the channel.
Price bounced from support and reclaimed short-term structure.
The setup anticipates a continuation move toward the upper resistance area.
Key Levels
Support Zone
64,098 (minor support)
63,902 (major support)
Resistance
64,700–64,800 (channel resistance)
65,200–65,400 (intermediate resistance)
65,634 (main target marked on the chart)
Trade Idea (Educational)
Long Setup
Entry: 64,100–64,300 on a confirmed hold above support.
Stop Loss: below 63,900 (around 63,873 as marked).
TP1: 64,700
TP2: 65,200
TP3: 65,634
Risk-to-Reward
Risk is relatively small compared with the projected upside.
If price breaks and closes below 63,900, the bullish setup becomes invalid.
What to Watch
Bullish confirmation: A strong 15M candle closing above 64,400–64,450.
Bearish warning: Rejection from the mid-channel followed by a break under 64,100.
Invalidation: Sustained trading below 63,900 could open the door to deeper downside.
Overall Bias
BULLISH
As long as BTC remains above the highlighted 63,900 support zone, the chart favors a continuation toward 65,634 and potentially the upper boundary of the rising channel.
TradingView Title
Market Structure
Timeframe: 15 Minutes
Current Price: around 64,309.
Price has been trading inside an ascending channel.
A strong rejection wick occurred near the lower boundary, followed by a recovery.
The chart highlights a support zone around 64,100–63,900, suggesting buyers are defending this area.
Bullish Bias
Higher lows continue to form within the channel.
Price bounced from support and reclaimed short-term structure.
The setup anticipates a continuation move toward the upper resistance area.
Key Levels
Support Zone
64,098 (minor support)
63,902 (major support)
Resistance
64,700–64,800 (channel resistance)
65,200–65,400 (intermediate resistance)
65,634 (main target marked on the chart)
Trade Idea (Educational)
Long Setup
Entry: 64,100–64,300 on a confirmed hold above support.
Stop Loss: below 63,900 (around 63,873 as marked).
TP1: 64,700
TP2: 65,200
TP3: 65,634
Risk-to-Reward
Risk is relatively small compared with the projected upside.
If price breaks and closes below 63,900, the bullish setup becomes invalid.
What to Watch
Bullish confirmation: A strong 15M candle closing above 64,400–64,450.
Bearish warning: Rejection from the mid-channel followed by a break under 64,100.
Invalidation: Sustained trading below 63,900 could open the door to deeper downside.
Overall Bias
BULLISH
As long as BTC remains above the highlighted 63,900 support zone, the chart favors a continuation toward 65,634 and potentially the upper boundary of the rising channel.
TradingView Title

JOIN MY TELEGRAM CHANNEL LINK t.me/mindgolde JOIN MY TELEGRAM CHANNEL LINK t.me/mindgolde
คำจำกัดสิทธิ์ความรับผิดชอบ
ข้อมูลและบทความไม่ได้มีวัตถุประสงค์เพื่อก่อให้เกิดกิจกรรมทางการเงิน, การลงทุน, การซื้อขาย, ข้อเสนอแนะ หรือคำแนะนำประเภทอื่น ๆ ที่ให้หรือรับรองโดย TradingView อ่านเพิ่มเติมใน ข้อกำหนดการใช้งาน
JOIN MY TELEGRAM CHANNEL LINK t.me/mindgolde JOIN MY TELEGRAM CHANNEL LINK t.me/mindgolde
คำจำกัดสิทธิ์ความรับผิดชอบ
ข้อมูลและบทความไม่ได้มีวัตถุประสงค์เพื่อก่อให้เกิดกิจกรรมทางการเงิน, การลงทุน, การซื้อขาย, ข้อเสนอแนะ หรือคำแนะนำประเภทอื่น ๆ ที่ให้หรือรับรองโดย TradingView อ่านเพิ่มเติมใน ข้อกำหนดการใช้งาน