
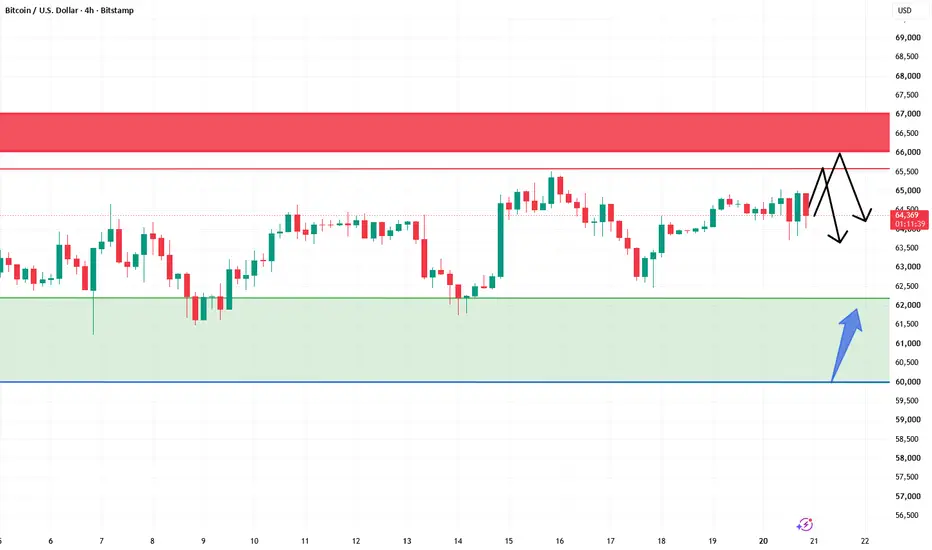
The price of Bitcoin fluctuated around 64K. On the 1-hour chart, the RSI is around 40-50, in the neutral zone; the MACD short-term line is slightly lower than the long-term line, indicating a slight advantage for the bears; the price is near the 50-hour moving average (~64K). The 4-hour chart shows a flat trend, with no clear crossover of short-term moving averages yet, indicating that the bulls and bears are still locked in a battle. The overall short-term trend has not yet shown a clear direction. Key daily resistance is around $64.4K–$64.5K; a break below short-term support would target $62K.

คำจำกัดสิทธิ์ความรับผิดชอบ
ข้อมูลและบทความไม่ได้มีวัตถุประสงค์เพื่อก่อให้เกิดกิจกรรมทางการเงิน, การลงทุน, การซื้อขาย, ข้อเสนอแนะ หรือคำแนะนำประเภทอื่น ๆ ที่ให้หรือรับรองโดย TradingView อ่านเพิ่มเติมใน ข้อกำหนดการใช้งาน
คำจำกัดสิทธิ์ความรับผิดชอบ
ข้อมูลและบทความไม่ได้มีวัตถุประสงค์เพื่อก่อให้เกิดกิจกรรมทางการเงิน, การลงทุน, การซื้อขาย, ข้อเสนอแนะ หรือคำแนะนำประเภทอื่น ๆ ที่ให้หรือรับรองโดย TradingView อ่านเพิ่มเติมใน ข้อกำหนดการใช้งาน