
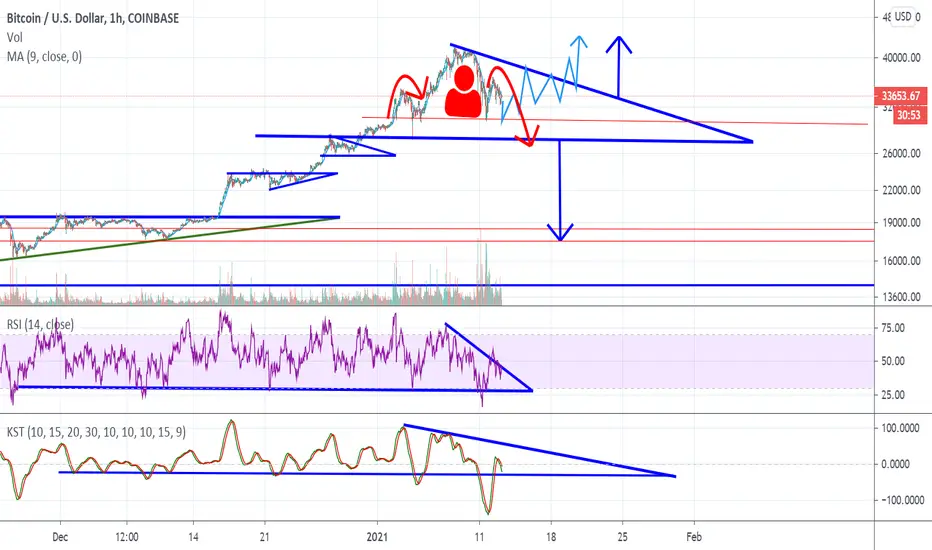
Bitcoin is potentially forming a giant H&S pattern inside of a larger Descending Triangle or Bullish Flag.
In light blue, I have drawn a hypothetical price scenario.
The RSI is breaking the downward sloping resistance of a descending triangle formation.
The KST saw a sharp deviation but has since found itself back into what could turn out as a bull flag or descending triangle.
In Dark Red inside the price pattern is potentially an H&S pattern.
In light blue, I have drawn a hypothetical price scenario.
The RSI is breaking the downward sloping resistance of a descending triangle formation.
The KST saw a sharp deviation but has since found itself back into what could turn out as a bull flag or descending triangle.
In Dark Red inside the price pattern is potentially an H&S pattern.
บันทึก
Bullish cross now apparent on the KST, updated chart here.. 

การนำเสนอที่เกี่ยวข้อง
คำจำกัดสิทธิ์ความรับผิดชอบ
ข้อมูลและบทความไม่ได้มีวัตถุประสงค์เพื่อก่อให้เกิดกิจกรรมทางการเงิน, การลงทุน, การซื้อขาย, ข้อเสนอแนะ หรือคำแนะนำประเภทอื่น ๆ ที่ให้หรือรับรองโดย TradingView อ่านเพิ่มเติมใน ข้อกำหนดการใช้งาน
การนำเสนอที่เกี่ยวข้อง
คำจำกัดสิทธิ์ความรับผิดชอบ
ข้อมูลและบทความไม่ได้มีวัตถุประสงค์เพื่อก่อให้เกิดกิจกรรมทางการเงิน, การลงทุน, การซื้อขาย, ข้อเสนอแนะ หรือคำแนะนำประเภทอื่น ๆ ที่ให้หรือรับรองโดย TradingView อ่านเพิ่มเติมใน ข้อกำหนดการใช้งาน