
Hi friends,
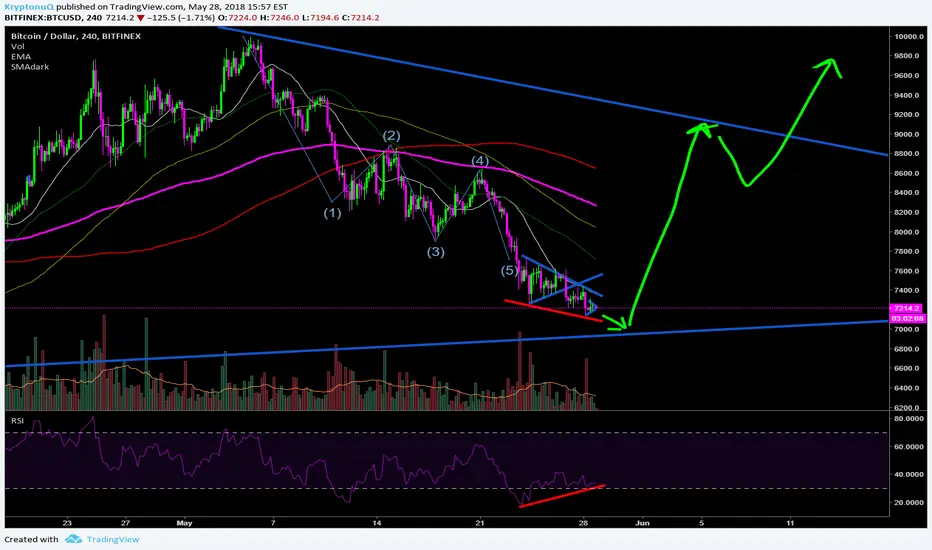
Looking at the 4H chart, we can see a divergence on the RSI that indicates a possible reversal. The turning point should, be the blue trendline at 7k - 6.9k. Looking at buy orders there is a significant buying power between 7k and 6.9k.
I do think everyone is waiting for this buying opportunity.
If we make this reversal, then the target price is the other blue trendline above at 9k. After a small pullback from there, I think we gonna break out from this triangle upwards.
***This is not a financial advice. It is only for educational purpose.***
If you think it was helpful, please leave a like, it means a lot to me. If you have any questions, feel free to leave a comment below.
บันทึก
Sorry for the missleading elliot waves, the 5th wave is incorrect.
คำจำกัดสิทธิ์ความรับผิดชอบ
ข้อมูลและบทความไม่ได้มีวัตถุประสงค์เพื่อก่อให้เกิดกิจกรรมทางการเงิน, การลงทุน, การซื้อขาย, ข้อเสนอแนะ หรือคำแนะนำประเภทอื่น ๆ ที่ให้หรือรับรองโดย TradingView อ่านเพิ่มเติมใน ข้อกำหนดการใช้งาน
คำจำกัดสิทธิ์ความรับผิดชอบ
ข้อมูลและบทความไม่ได้มีวัตถุประสงค์เพื่อก่อให้เกิดกิจกรรมทางการเงิน, การลงทุน, การซื้อขาย, ข้อเสนอแนะ หรือคำแนะนำประเภทอื่น ๆ ที่ให้หรือรับรองโดย TradingView อ่านเพิ่มเติมใน ข้อกำหนดการใช้งาน