
#BTC 3d
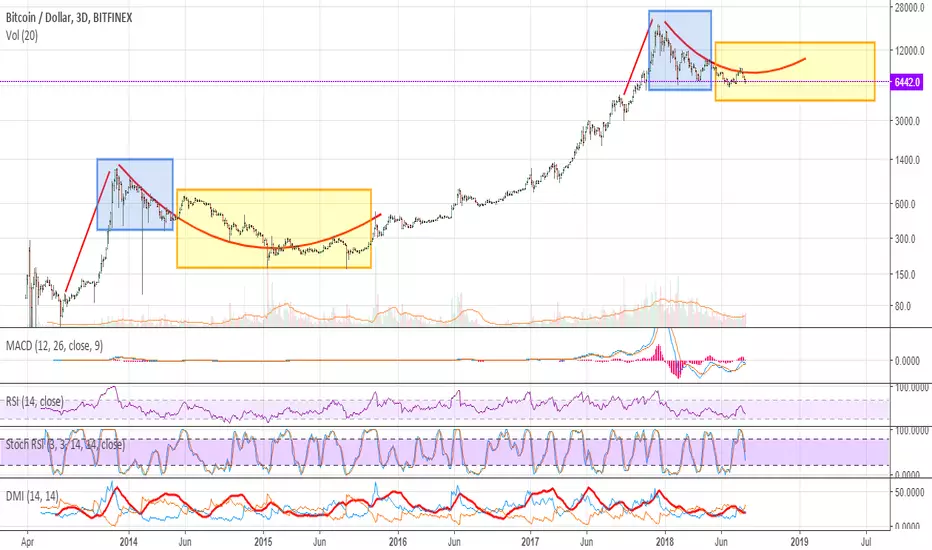
If we consider variants of similar fractals, then looking at the BTC chart starting from 2013, you can see that there is a chance to repeat the move in the yellow rectangle. This scenario was published as early as April 22nd, and by the current moment the market follows this analysis.
If we consider variants of similar fractals, then looking at the BTC chart starting from 2013, you can see that there is a chance to repeat the move in the yellow rectangle. This scenario was published as early as April 22nd, and by the current moment the market follows this analysis.

คำจำกัดสิทธิ์ความรับผิดชอบ
ข้อมูลและบทความไม่ได้มีวัตถุประสงค์เพื่อก่อให้เกิดกิจกรรมทางการเงิน, การลงทุน, การซื้อขาย, ข้อเสนอแนะ หรือคำแนะนำประเภทอื่น ๆ ที่ให้หรือรับรองโดย TradingView อ่านเพิ่มเติมใน ข้อกำหนดการใช้งาน
คำจำกัดสิทธิ์ความรับผิดชอบ
ข้อมูลและบทความไม่ได้มีวัตถุประสงค์เพื่อก่อให้เกิดกิจกรรมทางการเงิน, การลงทุน, การซื้อขาย, ข้อเสนอแนะ หรือคำแนะนำประเภทอื่น ๆ ที่ให้หรือรับรองโดย TradingView อ่านเพิ่มเติมใน ข้อกำหนดการใช้งาน