
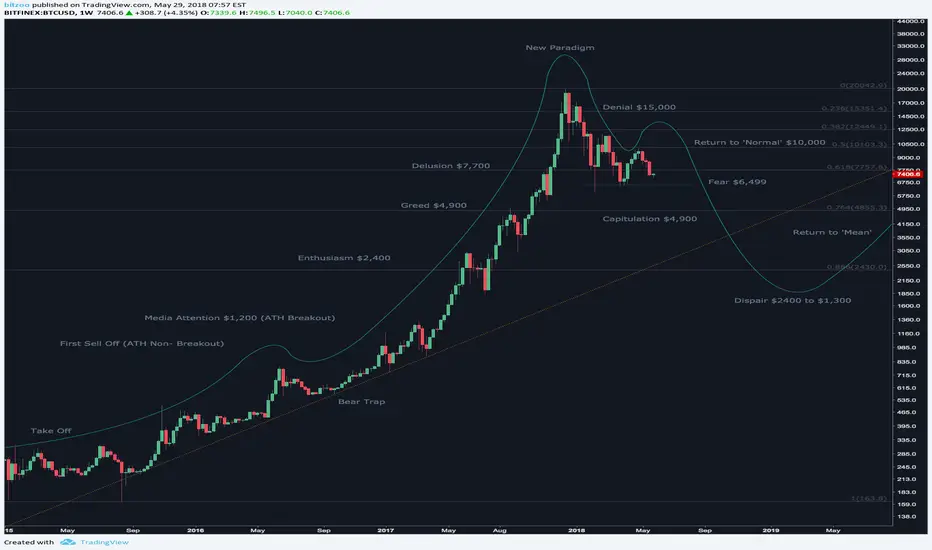
This chart is just for fun. Unless you are a Bull of course.
I have applied the stages of a bubble from here: transportgeography.org/?page_id=9035 - This is a worst case scenario for BTC.
I used fibs from the bottom at $162 to the top of the bull run at $19,900 to work out rough prices for the stages.
I have applied the stages of a bubble from here: transportgeography.org/?page_id=9035 - This is a worst case scenario for BTC.
I used fibs from the bottom at $162 to the top of the bull run at $19,900 to work out rough prices for the stages.

การนำเสนอที่เกี่ยวข้อง
คำจำกัดสิทธิ์ความรับผิดชอบ
ข้อมูลและบทความไม่ได้มีวัตถุประสงค์เพื่อก่อให้เกิดกิจกรรมทางการเงิน, การลงทุน, การซื้อขาย, ข้อเสนอแนะ หรือคำแนะนำประเภทอื่น ๆ ที่ให้หรือรับรองโดย TradingView อ่านเพิ่มเติมใน ข้อกำหนดการใช้งาน
การนำเสนอที่เกี่ยวข้อง
คำจำกัดสิทธิ์ความรับผิดชอบ
ข้อมูลและบทความไม่ได้มีวัตถุประสงค์เพื่อก่อให้เกิดกิจกรรมทางการเงิน, การลงทุน, การซื้อขาย, ข้อเสนอแนะ หรือคำแนะนำประเภทอื่น ๆ ที่ให้หรือรับรองโดย TradingView อ่านเพิ่มเติมใน ข้อกำหนดการใช้งาน