
Executive Summary
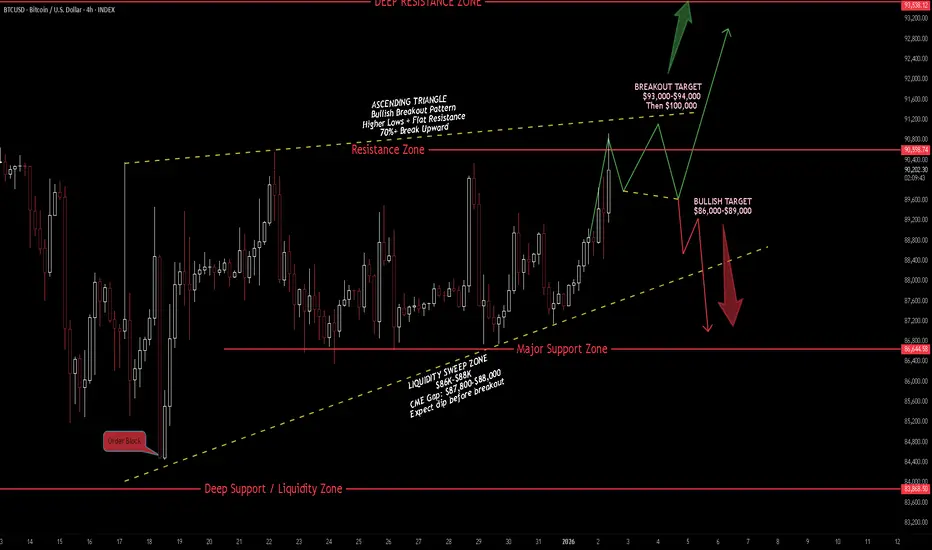
Bitcoin is trading at $90,529 on the first trading day of 2026, testing the upper resistance of an ascending triangle on the 4H timeframe. Price has rallied +2% today as dip buyers stepped in aggressively. The structure suggests a short-term pullback to sweep liquidity below $88K before breaking the ascending pattern and bursting higher.
BIAS: BULLISH - Short-Term Dip, Then Breakout
Current Market Data
- Current: $90,529 (+1.98%)
- Day's Range: $88,309 - $90,927
- October Peak: $126,000
- Key Support: $86,000-$88,000
- Fear & Greed Index: 36 (Fear → improving)
What's Driving the Rally
- "January Effect" - Tax-loss selling ended, capital redeploying
- Whale accumulation visible on-chain
- Open interest up 2% to $130B - leveraged bulls entering
- $217.82M in shorts liquidated in 24 hours
- Meme coins rallying (PEPE +32%) - risk-on returning
- Fed rate cuts expected by March
Key News Context
- Bitcoin's four-year cycle officially broken - first red post-halving year
- ETF effect pulled liquidity forward into 2024
- BlackRock deposited 1,134 BTC ($101.4M) to Binance - bearish signal
- But whales reducing exchange deposits - bullish signal
- Zero Bitcoin obituaries in 2025 - first time since Satoshi era
Technical Structure - 4H
Ascending Triangle Pattern:
- Rising support trendline (yellow dashed) - higher lows
- Horizontal resistance at $90,000-$90,500 (pink zone)
- Price compressing toward apex
- Typically bullish breakout pattern (70%+)
Key Levels:
Resistance:
- $90,000 - $90,500 - Horizontal resistance (pink zone)
- $93,000 - $93,200 - Upper target zone
- $100,000 - Psychological level
Support:
- $88,000 - CME gap zone ($87,800-$88,000)
- $86,000 - $86,500 - Major support zone (pink)
- $84,000 - $84,500 - Deep support / liquidity pool
Liquidity Analysis
- Heavy liquidation clusters below $88,000
- More intense bands near $86,000 and $84,500
- CME gap at $87,800-$88,000 - likely to be filled
- Thin resistance between $91,000-$94,000 if breakout occurs
SCENARIO ANALYSIS
PRIMARY: Liquidity Sweep Then Breakout
- Short-term dip to $86,000-$88,000 to sweep liquidity
- Fill CME gap at $87,800-$88,000
- Bounce off ascending trendline support
- Break above $90,500 resistance
- Target $93,000-$94,000, then $100,000
BULLISH: Direct Breakout
Trigger: 4H close above $90,500 with volume
Targets: $93,000 → $94,000 → $100,000
BEARISH: Triangle Breakdown
Trigger: Break below $86,000 and ascending trendline
Targets: $84,500 → $83,000 → $80,000
My Assessment
Ascending triangle at resistance with liquidity pools below. Expect short-term dip to sweep $86K-$88K liquidity, fill CME gap, then break ascending pattern and burst higher. Risk-on sentiment returning, whale accumulation, and January Effect support bullish thesis.
Strategy:
- Wait for dip to $86,000-$88,000 zone
- Long on bounce with stop below $84,500
- Target $93,000-$94,000, then $100,000
- Or long on confirmed breakout above $90,500
Drop your comments below on what you think is the NEXT MOVE!

The AI Trading Ecosystem, Built to win trades 📈
Get Full Access 👇
jackofalltrades.vip 🌐
t.me/jackofalltradesvip 🃏
Get Full Access 👇
jackofalltrades.vip 🌐
t.me/jackofalltradesvip 🃏
คำจำกัดสิทธิ์ความรับผิดชอบ
ข้อมูลและบทความไม่ได้มีวัตถุประสงค์เพื่อก่อให้เกิดกิจกรรมทางการเงิน, การลงทุน, การซื้อขาย, ข้อเสนอแนะ หรือคำแนะนำประเภทอื่น ๆ ที่ให้หรือรับรองโดย TradingView อ่านเพิ่มเติมใน ข้อกำหนดการใช้งาน
The AI Trading Ecosystem, Built to win trades 📈
Get Full Access 👇
jackofalltrades.vip 🌐
t.me/jackofalltradesvip 🃏
Get Full Access 👇
jackofalltrades.vip 🌐
t.me/jackofalltradesvip 🃏
คำจำกัดสิทธิ์ความรับผิดชอบ
ข้อมูลและบทความไม่ได้มีวัตถุประสงค์เพื่อก่อให้เกิดกิจกรรมทางการเงิน, การลงทุน, การซื้อขาย, ข้อเสนอแนะ หรือคำแนะนำประเภทอื่น ๆ ที่ให้หรือรับรองโดย TradingView อ่านเพิ่มเติมใน ข้อกำหนดการใช้งาน