My latest thinking on BTC:
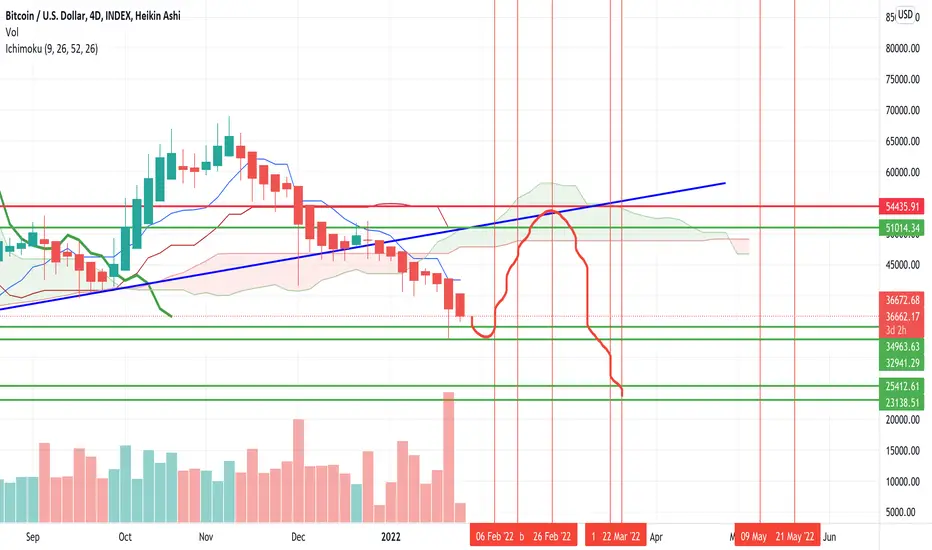
BTC is in the process of carving a bottom. I think there's likely to be one more pullback to test support here at the $32-34k region and/or slightly sweep the lows before BTC starts moving higher towards the last week of January.
Then I think we should see a strong bounce in BTC which surges upwards towards the $51k region either stopping at that support and reversing lower, or potentially extending all the way up to the $54k resistance before turning lower.
At that point, I anticipate the entire market flipping bullish because of how quickly we bounced, however, I think at that point (towards the middle/end of February), BTC will reverse lower and sweep the lows ending up at support in the $23k-25k region. This should happen towards the middle of March to the middle of April.
Let's see what happens from here. I'll update as I see price action change. The dates on the chart are important pivots for price action.
BTC is in the process of carving a bottom. I think there's likely to be one more pullback to test support here at the $32-34k region and/or slightly sweep the lows before BTC starts moving higher towards the last week of January.
Then I think we should see a strong bounce in
BTC which surges upwards towards the $51k region either stopping at that support and reversing lower, or potentially extending all the way up to the $54k resistance before turning lower.At that point, I anticipate the entire market flipping bullish because of how quickly we bounced, however, I think at that point (towards the middle/end of February), BTC will reverse lower and sweep the lows ending up at support in the $23k-25k region. This should happen towards the middle of March to the middle of April.
Let's see what happens from here. I'll update as I see price action change. The dates on the chart are important pivots for price action.

คำจำกัดสิทธิ์ความรับผิดชอบ
ข้อมูลและบทความไม่ได้มีวัตถุประสงค์เพื่อก่อให้เกิดกิจกรรมทางการเงิน, การลงทุน, การซื้อขาย, ข้อเสนอแนะ หรือคำแนะนำประเภทอื่น ๆ ที่ให้หรือรับรองโดย TradingView อ่านเพิ่มเติมใน ข้อกำหนดการใช้งาน
คำจำกัดสิทธิ์ความรับผิดชอบ
ข้อมูลและบทความไม่ได้มีวัตถุประสงค์เพื่อก่อให้เกิดกิจกรรมทางการเงิน, การลงทุน, การซื้อขาย, ข้อเสนอแนะ หรือคำแนะนำประเภทอื่น ๆ ที่ให้หรือรับรองโดย TradingView อ่านเพิ่มเติมใน ข้อกำหนดการใช้งาน