
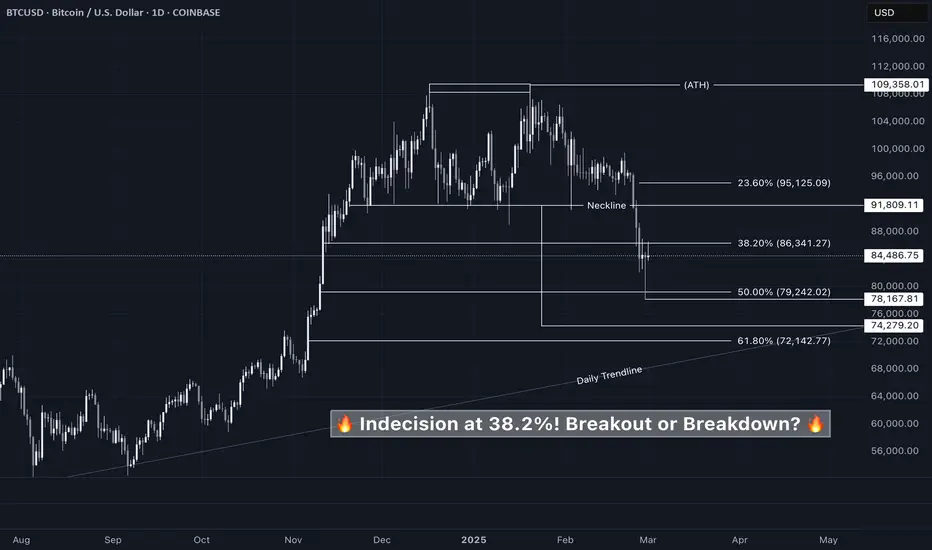
After a strong breakout from a falling wedge and handle pattern on Wednesday, Nov 6, 2024, price surged to an All-Time High of 109,358.01. However, a retracement followed, with the formation of a double top pattern leading to a breakdown below the neckline at 91,809.11, sending prices tumbling to 78,167.81, perfectly aligning with the golden ratio (50% Fibonacci level).
From there, buyers stepped in, pushing the price back up to the 38.2% Fibonacci level, but strong resistance led to two rejections and the formation of three consecutive doji candles, signalling market indecision.
What’s Next?
🔹 Bullish Scenario: A breakout above 38.2% could lead to a neckline retest 91,809.11.
🔹 Bearish Scenario: If rejection holds, the double top projection targets is 74,279.20, with further downside towards 61.8% or 66%, aligning with the daily trendline.
📢 Risk Management Reminder:
The market is at a critical level—manage your risk wisely! Set stop losses, use proper position sizing, and avoid over-leveraging. Patience and discipline are key!
From there, buyers stepped in, pushing the price back up to the 38.2% Fibonacci level, but strong resistance led to two rejections and the formation of three consecutive doji candles, signalling market indecision.
What’s Next?
🔹 Bullish Scenario: A breakout above 38.2% could lead to a neckline retest 91,809.11.
🔹 Bearish Scenario: If rejection holds, the double top projection targets is 74,279.20, with further downside towards 61.8% or 66%, aligning with the daily trendline.
📢 Risk Management Reminder:
The market is at a critical level—manage your risk wisely! Set stop losses, use proper position sizing, and avoid over-leveraging. Patience and discipline are key!
ปิดการเทรด: ถึงเป้าหมายการทำกำไร

การนำเสนอที่เกี่ยวข้อง
คำจำกัดสิทธิ์ความรับผิดชอบ
ข้อมูลและบทความไม่ได้มีวัตถุประสงค์เพื่อก่อให้เกิดกิจกรรมทางการเงิน, การลงทุน, การซื้อขาย, ข้อเสนอแนะ หรือคำแนะนำประเภทอื่น ๆ ที่ให้หรือรับรองโดย TradingView อ่านเพิ่มเติมใน ข้อกำหนดการใช้งาน
การนำเสนอที่เกี่ยวข้อง
คำจำกัดสิทธิ์ความรับผิดชอบ
ข้อมูลและบทความไม่ได้มีวัตถุประสงค์เพื่อก่อให้เกิดกิจกรรมทางการเงิน, การลงทุน, การซื้อขาย, ข้อเสนอแนะ หรือคำแนะนำประเภทอื่น ๆ ที่ให้หรือรับรองโดย TradingView อ่านเพิ่มเติมใน ข้อกำหนดการใช้งาน