
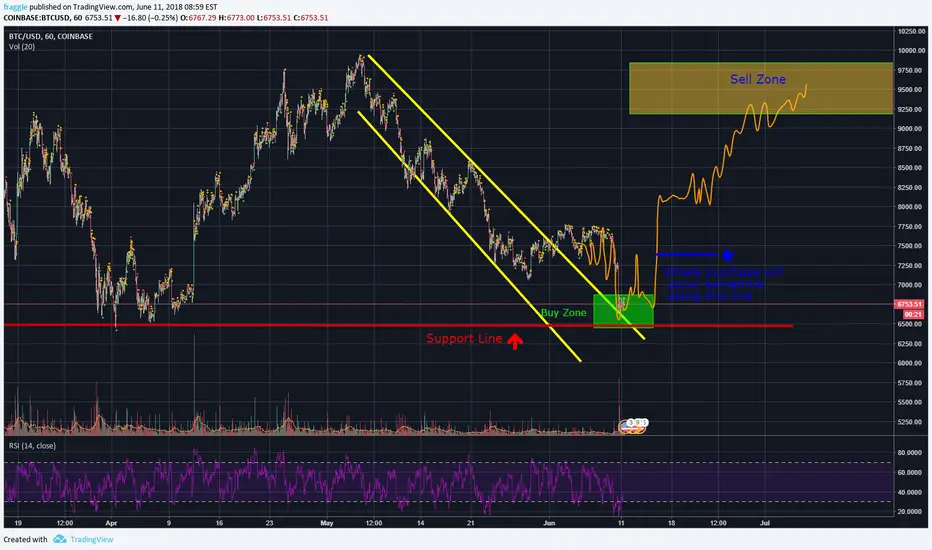
From my previous chart Here:  You can see on the CURRENT chart at top BTC is bouncing off the down trend line as support.
-Time-frame of previous chart moved to the right to match when the drop occured
-Bought in the 6600's HODLing until $9k ish
-Look for BTC to bounce off the trend line again then a whale purchase will occur
-Time-frame of previous chart moved to the right to match when the drop occured
-Bought in the 6600's HODLing until $9k ish
-Look for BTC to bounce off the trend line again then a whale purchase will occur

การนำเสนอที่เกี่ยวข้อง
คำจำกัดสิทธิ์ความรับผิดชอบ
ข้อมูลและบทความไม่ได้มีวัตถุประสงค์เพื่อก่อให้เกิดกิจกรรมทางการเงิน, การลงทุน, การซื้อขาย, ข้อเสนอแนะ หรือคำแนะนำประเภทอื่น ๆ ที่ให้หรือรับรองโดย TradingView อ่านเพิ่มเติมใน ข้อกำหนดการใช้งาน
การนำเสนอที่เกี่ยวข้อง
คำจำกัดสิทธิ์ความรับผิดชอบ
ข้อมูลและบทความไม่ได้มีวัตถุประสงค์เพื่อก่อให้เกิดกิจกรรมทางการเงิน, การลงทุน, การซื้อขาย, ข้อเสนอแนะ หรือคำแนะนำประเภทอื่น ๆ ที่ให้หรือรับรองโดย TradingView อ่านเพิ่มเติมใน ข้อกำหนดการใช้งาน