
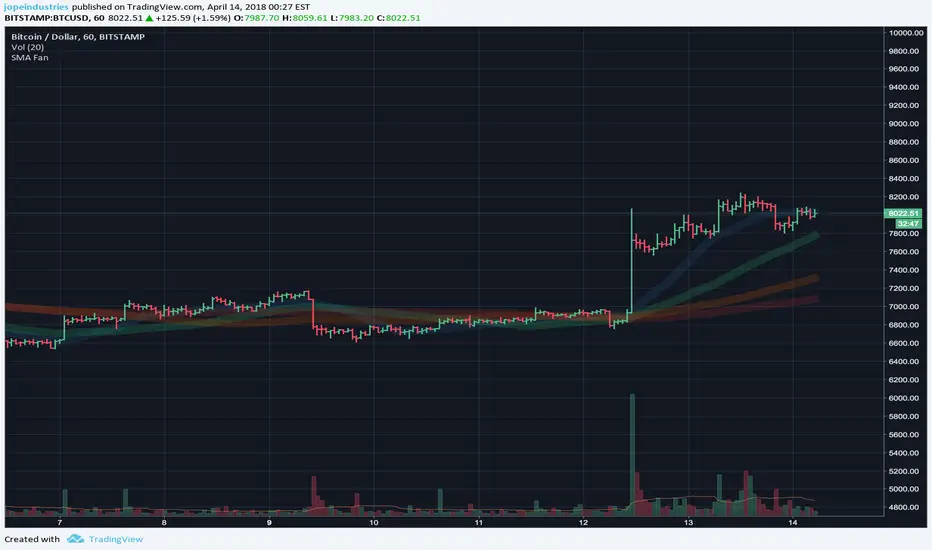
Notice that the SMAs have reconciled to their normal uptrend position in the hourly charts.
Watch for the SMA(20) to cross under the SMA(50) as a cue for a reversal to the downside.
Look for continuation of the nascent uptrend if this pattern spreads to the 2-hour, 4-hour and daily charts.
Watch for the SMA(20) to cross under the SMA(50) as a cue for a reversal to the downside.
Look for continuation of the nascent uptrend if this pattern spreads to the 2-hour, 4-hour and daily charts.
บันทึก
The 2-hour chart appears to have just crossed up. The 4-hour bars still have a way to go.บันทึก
Happily, order is restored in the 1-day bar interval chart now.บันทึก
Whoops, ignore that last update. My chart settings reset.Still watching the 4-hour bars to see if the trend continues.

คำจำกัดสิทธิ์ความรับผิดชอบ
ข้อมูลและบทความไม่ได้มีวัตถุประสงค์เพื่อก่อให้เกิดกิจกรรมทางการเงิน, การลงทุน, การซื้อขาย, ข้อเสนอแนะ หรือคำแนะนำประเภทอื่น ๆ ที่ให้หรือรับรองโดย TradingView อ่านเพิ่มเติมใน ข้อกำหนดการใช้งาน
คำจำกัดสิทธิ์ความรับผิดชอบ
ข้อมูลและบทความไม่ได้มีวัตถุประสงค์เพื่อก่อให้เกิดกิจกรรมทางการเงิน, การลงทุน, การซื้อขาย, ข้อเสนอแนะ หรือคำแนะนำประเภทอื่น ๆ ที่ให้หรือรับรองโดย TradingView อ่านเพิ่มเติมใน ข้อกำหนดการใช้งาน