
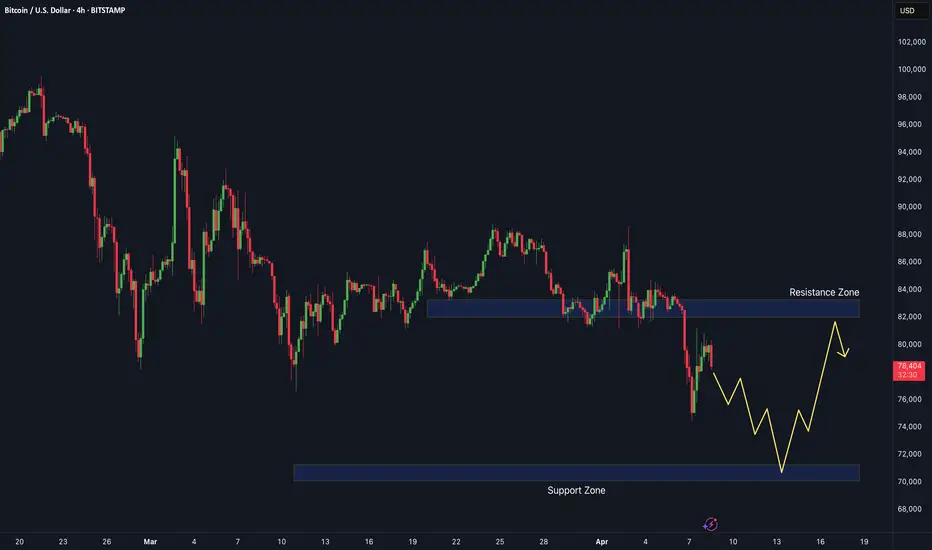
📝 🚀 BTC/USD – 4H Price Action Masterclass | Breakout Brewing Between $71.2K & $72K!
Bitcoin is currently consolidating in a high-tension zone on the 4-hour chart, forming a classic range-bound structure between two key levels:
🔹 Support at $71,200 – a previous resistance now acting as short-term demand
🔹 Resistance at $72,000 – a strong psychological barrier that price has failed to close above
This tightening range is setting the stage for a high-impact move, and the market is showing signs of compression. No indicators, no noise — just clean structure and price action clarity.
🔍 Detailed Technical Breakdown:
📌 $71,200 – Flip Zone:
Recently flipped from resistance to support after a breakout. Price is now retesting this level with precision, suggesting potential accumulation — but failure here may trigger strong selling pressure.
📌 $72,000 – Critical Resistance:
This level has held price down for multiple sessions. If bulls manage to close above it on strong volume, we could see a push towards 73K+, where liquidity clusters await.
⚔️ Battle of the Zones – What to Expect Next?
Bullish Scenario: A breakout above $72,000 on strong bullish candles could ignite a move toward the next resistance at $73,500–$74,000.
Bearish Scenario: If $71,200 breaks down, expect a sharp drop toward $70,400, possibly extending to the $69K handle.
This setup offers a textbook example of how support/resistance zones act as battlegrounds for short-term market control.
🔥 Why This Chart Matters (No Indicators Used):
Clean price action = clean decision-making.
Ideal for breakout traders & range scalpers.
High probability setup with defined risk levels.
Easy to read & replicate — especially for beginners learning PA.
💬 What’s YOUR take?
Are we about to see a bullish explosion, or is this a trap before a deeper drop?
👇 Drop your analysis in the comments – let’s build a real traders’ conversation below!
📈 If you found this chart helpful, don’t forget to like & follow for more clean setups.
Bitcoin is currently consolidating in a high-tension zone on the 4-hour chart, forming a classic range-bound structure between two key levels:
🔹 Support at $71,200 – a previous resistance now acting as short-term demand
🔹 Resistance at $72,000 – a strong psychological barrier that price has failed to close above
This tightening range is setting the stage for a high-impact move, and the market is showing signs of compression. No indicators, no noise — just clean structure and price action clarity.
🔍 Detailed Technical Breakdown:
📌 $71,200 – Flip Zone:
Recently flipped from resistance to support after a breakout. Price is now retesting this level with precision, suggesting potential accumulation — but failure here may trigger strong selling pressure.
📌 $72,000 – Critical Resistance:
This level has held price down for multiple sessions. If bulls manage to close above it on strong volume, we could see a push towards
73K+, where liquidity clusters await.⚔️ Battle of the Zones – What to Expect Next?
Bullish Scenario: A breakout above $72,000 on strong bullish candles could ignite a move toward the next resistance at $73,500–$74,000.
Bearish Scenario: If $71,200 breaks down, expect a sharp drop toward $70,400, possibly extending to the $69K handle.
This setup offers a textbook example of how support/resistance zones act as battlegrounds for short-term market control.
🔥 Why This Chart Matters (No Indicators Used):
Clean price action = clean decision-making.
Ideal for breakout traders & range scalpers.
High probability setup with defined risk levels.
Easy to read & replicate — especially for beginners learning PA.
💬 What’s YOUR take?
Are we about to see a bullish explosion, or is this a trap before a deeper drop?
👇 Drop your analysis in the comments – let’s build a real traders’ conversation below!
📈 If you found this chart helpful, don’t forget to like & follow for more clean setups.

คำจำกัดสิทธิ์ความรับผิดชอบ
ข้อมูลและบทความไม่ได้มีวัตถุประสงค์เพื่อก่อให้เกิดกิจกรรมทางการเงิน, การลงทุน, การซื้อขาย, ข้อเสนอแนะ หรือคำแนะนำประเภทอื่น ๆ ที่ให้หรือรับรองโดย TradingView อ่านเพิ่มเติมใน ข้อกำหนดการใช้งาน
คำจำกัดสิทธิ์ความรับผิดชอบ
ข้อมูลและบทความไม่ได้มีวัตถุประสงค์เพื่อก่อให้เกิดกิจกรรมทางการเงิน, การลงทุน, การซื้อขาย, ข้อเสนอแนะ หรือคำแนะนำประเภทอื่น ๆ ที่ให้หรือรับรองโดย TradingView อ่านเพิ่มเติมใน ข้อกำหนดการใช้งาน