
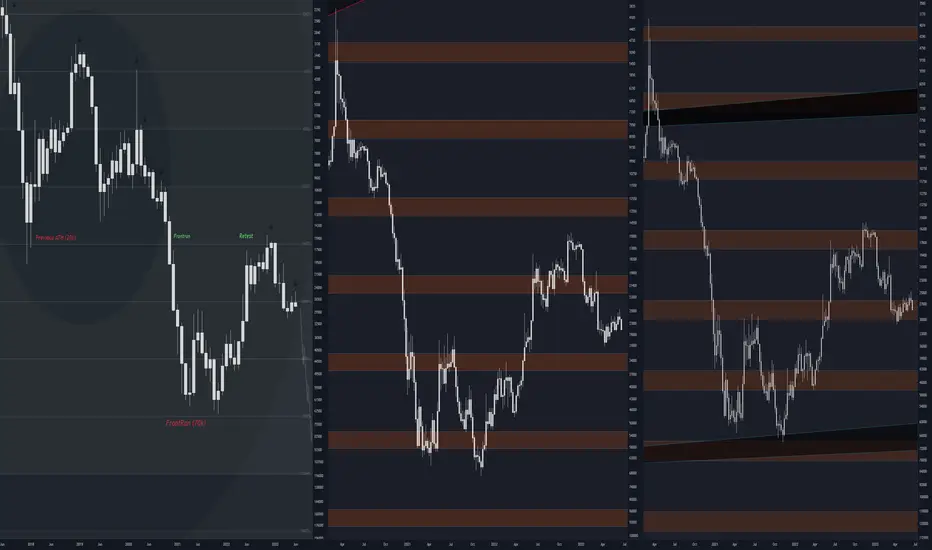
In this analysis, we examine three INVERTED schematics of Bitcoin’s price dynamics— one monthly and two weekly charts.
The first schematic, an inverted monthly timeframe, illustrates a remarkable adherence to the support and resistance levels through opens/closes/wicks, showcasing pivotal turning points on a Monthly Timescale.
These two weekly charts on the right reveal well-ratioed price movements, suggesting a degree of proportionality and predictability in Bitcoin's price behavior. This symmetry highlights the robustness of my technical analysis and the self-fulfilling nature of these levels.
Please refer to my other 250k Bitcoin Target Ideas linked below.
The first schematic, an inverted monthly timeframe, illustrates a remarkable adherence to the support and resistance levels through opens/closes/wicks, showcasing pivotal turning points on a Monthly Timescale.
These two weekly charts on the right reveal well-ratioed price movements, suggesting a degree of proportionality and predictability in Bitcoin's price behavior. This symmetry highlights the robustness of my technical analysis and the self-fulfilling nature of these levels.
Please refer to my other 250k Bitcoin Target Ideas linked below.
บันทึก
Aha! We 'bout to get funky, funkay, funkay
Clap, clap, clap, clap your hands
On this beat, we're making our stands.
Funky, funkay, across the lands.
Clap, clap... Faunky Faunky
Groove on this beat, there's no drawback...
We're getting funky, funkay, no looking back...
บันทึก
Funky, funkay, funkay..Clap.. clap.. clap.. clap your hands

การนำเสนอที่เกี่ยวข้อง
คำจำกัดสิทธิ์ความรับผิดชอบ
ข้อมูลและบทความไม่ได้มีวัตถุประสงค์เพื่อก่อให้เกิดกิจกรรมทางการเงิน, การลงทุน, การซื้อขาย, ข้อเสนอแนะ หรือคำแนะนำประเภทอื่น ๆ ที่ให้หรือรับรองโดย TradingView อ่านเพิ่มเติมใน ข้อกำหนดการใช้งาน
การนำเสนอที่เกี่ยวข้อง
คำจำกัดสิทธิ์ความรับผิดชอบ
ข้อมูลและบทความไม่ได้มีวัตถุประสงค์เพื่อก่อให้เกิดกิจกรรมทางการเงิน, การลงทุน, การซื้อขาย, ข้อเสนอแนะ หรือคำแนะนำประเภทอื่น ๆ ที่ให้หรือรับรองโดย TradingView อ่านเพิ่มเติมใน ข้อกำหนดการใช้งาน