
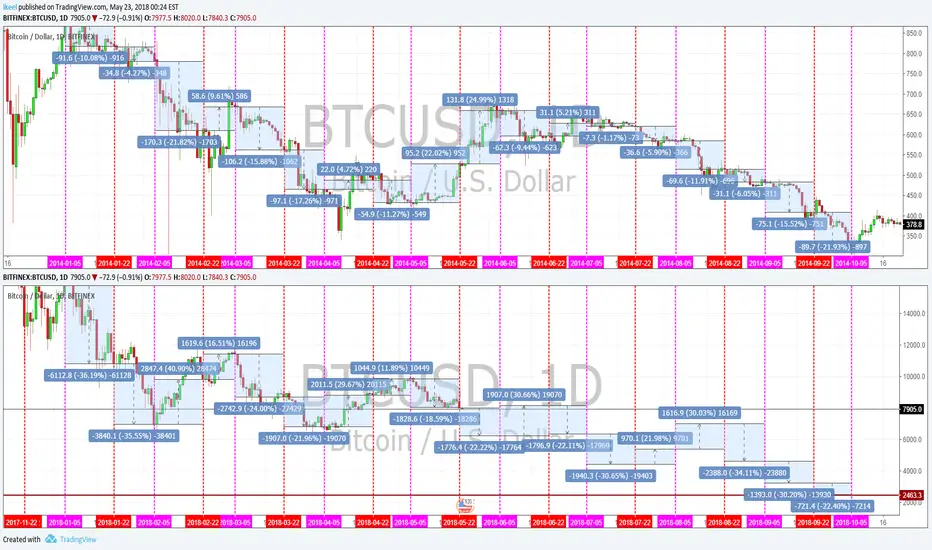
Here I compare price behavior in two types of intervals whilst comparing the 2014 & 2018 bear marketing starting from the new year.
Jan-Oct 2014 bear market:
Jan-Oct 2018 bear market:
Jan-Oct 2014 bear market:
- Red periods averaged 11.4% moves whilst Purple periods averaged 12.2% moves (from period candle close to close).
- Red periods saw twice as well downward moves, meanwhile Purple periods were 3.5x likely to be downward moves.
Jan-Oct 2018 bear market:
- Red periods averaged 22% moves whilst Purple periods averaged 30% moves (from period candle close to close).

คำจำกัดสิทธิ์ความรับผิดชอบ
ข้อมูลและบทความไม่ได้มีวัตถุประสงค์เพื่อก่อให้เกิดกิจกรรมทางการเงิน, การลงทุน, การซื้อขาย, ข้อเสนอแนะ หรือคำแนะนำประเภทอื่น ๆ ที่ให้หรือรับรองโดย TradingView อ่านเพิ่มเติมใน ข้อกำหนดการใช้งาน
คำจำกัดสิทธิ์ความรับผิดชอบ
ข้อมูลและบทความไม่ได้มีวัตถุประสงค์เพื่อก่อให้เกิดกิจกรรมทางการเงิน, การลงทุน, การซื้อขาย, ข้อเสนอแนะ หรือคำแนะนำประเภทอื่น ๆ ที่ให้หรือรับรองโดย TradingView อ่านเพิ่มเติมใน ข้อกำหนดการใช้งาน