
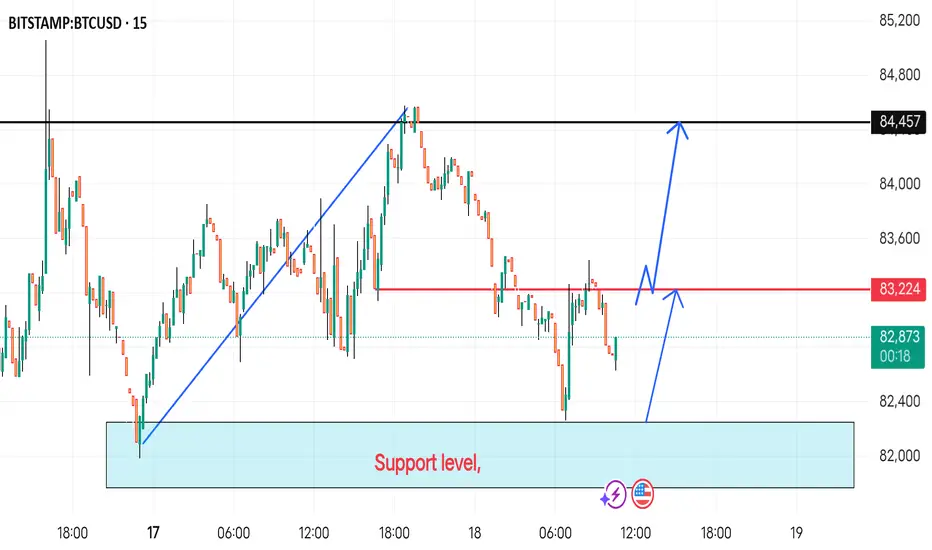
This BTC/USD chart shows a possible bullish setup based on support and resistance levels:
Support Zone (~82,000): The blue highlighted area represents a key support level where buyers might step in.
Resistance Levels:
83,224 (Red Line): A potential resistance level where price might react.
84,457 (Black Line): A stronger resistance level and the ultimate upside target.
Expected Scenarios (Blue Arrows):
1. Bounce from Support → Break 83,224 → Rally to 84,457.
2. Rejection at 83,224 → Retest Support → Second attempt at a breakout.
This suggests that if BTC holds above support, a bullish move is likely. If it fails, a retest of the support zone could happen.
Support Zone (~82,000): The blue highlighted area represents a key support level where buyers might step in.
Resistance Levels:
83,224 (Red Line): A potential resistance level where price might react.
84,457 (Black Line): A stronger resistance level and the ultimate upside target.
Expected Scenarios (Blue Arrows):
1. Bounce from Support → Break 83,224 → Rally to 84,457.
2. Rejection at 83,224 → Retest Support → Second attempt at a breakout.
This suggests that if BTC holds above support, a bullish move is likely. If it fails, a retest of the support zone could happen.

คำจำกัดสิทธิ์ความรับผิดชอบ
ข้อมูลและบทความไม่ได้มีวัตถุประสงค์เพื่อก่อให้เกิดกิจกรรมทางการเงิน, การลงทุน, การซื้อขาย, ข้อเสนอแนะ หรือคำแนะนำประเภทอื่น ๆ ที่ให้หรือรับรองโดย TradingView อ่านเพิ่มเติมใน ข้อกำหนดการใช้งาน
คำจำกัดสิทธิ์ความรับผิดชอบ
ข้อมูลและบทความไม่ได้มีวัตถุประสงค์เพื่อก่อให้เกิดกิจกรรมทางการเงิน, การลงทุน, การซื้อขาย, ข้อเสนอแนะ หรือคำแนะนำประเภทอื่น ๆ ที่ให้หรือรับรองโดย TradingView อ่านเพิ่มเติมใน ข้อกำหนดการใช้งาน