
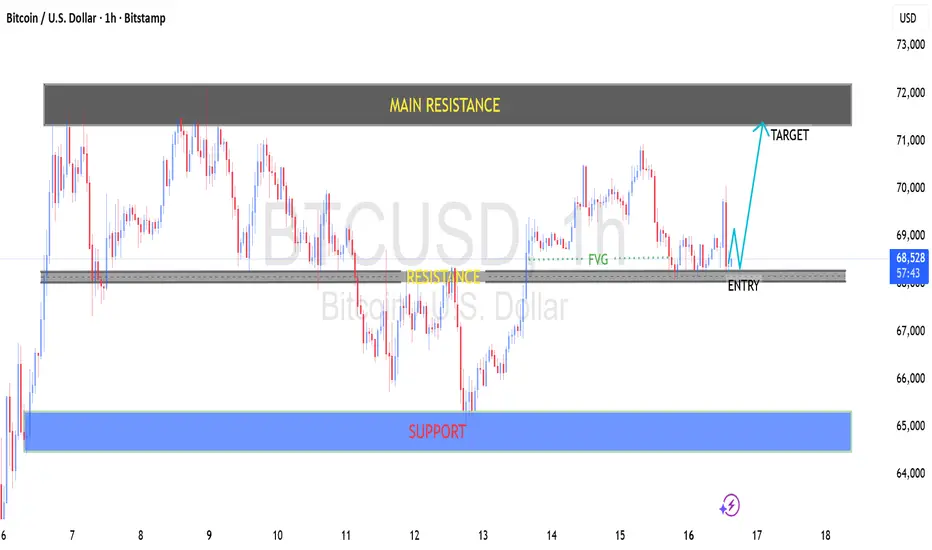
Bitcoin (BTC/USD) 1H Chart Analysis – Bullish Continuation Setup Toward Major Resistance
Chart Overview
The 1-hour BTC/USD (Bitstamp) chart shows a structured consolidation phase beneath a clearly defined higher-timeframe resistance zone, with price currently attempting to reclaim a prior intraday resistance area around 68,500.
The market structure suggests accumulation within range boundaries, with a potential bullish continuation toward the main resistance if current support holds.
1. Market Structure
Range Context
Main Resistance: ~71,800 – 72,200
Mid-Range Resistance (Flip Zone): ~68,400 – 68,700
Major Support: ~64,800 – 65,300
Price has been oscillating inside a broader range (65K–72K). The current structure shows:
Higher lows forming above the 65K support.
Repeated reactions around 68.5K, previously resistance.
A recent reclaim attempt of that level.
This indicates developing bullish pressure within the range.
2. Key Technical Zones
🔹 Main Resistance (72K Area)
This zone represents:
Previous distribution highs.
Rejection cluster with strong supply.
Liquidity resting above equal highs.
A break and hold above this area would likely trigger momentum expansion.
🔹 68.5K Resistance / Entry Zone
This level is critical because:
It acted as resistance multiple times.
Price is attempting to flip it into support.
A Fair Value Gap (FVG) sits slightly above, suggesting inefficiency to be filled.
If this level holds as support, it confirms short-term bullish control.
🔹 65K Major Support
Strong demand reaction previously.
Clear accumulation base.
Break below would invalidate the bullish structure and shift bias bearish.
3. Fair Value Gap (FVG) Context
The highlighted FVG above current price indicates:
A liquidity inefficiency left during prior bearish impulse.
Potential magnet for price.
Confluence with resistance flip zone.
Markets often retrace into these inefficiencies before continuation.
4. Trade Scenario (Bullish Bias)
Entry Concept:
Acceptance above 68,500 with confirmation (strong close + continuation).
Target:
Retest of 71,500 – 72,000 (main resistance liquidity zone).
Invalidation:
Sustained breakdown below 67,800 and especially below 65,000 support.
Risk Profile:
Favorable R:R if entering on confirmation rather than anticipation.
5. Order Flow & Momentum Insight
Selling pressure appears to be weakening.
Higher lows show buyer absorption.
Consolidation under resistance often precedes breakout.
Liquidity is resting above 72K — attractive for market makers.
6. Probability Outlook
Current bias: Moderately Bullish (60–65%)
Conditions required:
Clean hold above 68.5K
Increasing bullish momentum candles
No sharp rejection from FVG zone
Failure to hold 68.5K would shift the setup into continued range-bound chop.
⚠️ Educational Disclaimer
This analysis is provided strictly for educational and informational purposes only.
Chart Overview
The 1-hour BTC/USD (Bitstamp) chart shows a structured consolidation phase beneath a clearly defined higher-timeframe resistance zone, with price currently attempting to reclaim a prior intraday resistance area around 68,500.
The market structure suggests accumulation within range boundaries, with a potential bullish continuation toward the main resistance if current support holds.
1. Market Structure
Range Context
Main Resistance: ~71,800 – 72,200
Mid-Range Resistance (Flip Zone): ~68,400 – 68,700
Major Support: ~64,800 – 65,300
Price has been oscillating inside a broader range (65K–72K). The current structure shows:
Higher lows forming above the 65K support.
Repeated reactions around 68.5K, previously resistance.
A recent reclaim attempt of that level.
This indicates developing bullish pressure within the range.
2. Key Technical Zones
🔹 Main Resistance (72K Area)
This zone represents:
Previous distribution highs.
Rejection cluster with strong supply.
Liquidity resting above equal highs.
A break and hold above this area would likely trigger momentum expansion.
🔹 68.5K Resistance / Entry Zone
This level is critical because:
It acted as resistance multiple times.
Price is attempting to flip it into support.
A Fair Value Gap (FVG) sits slightly above, suggesting inefficiency to be filled.
If this level holds as support, it confirms short-term bullish control.
🔹 65K Major Support
Strong demand reaction previously.
Clear accumulation base.
Break below would invalidate the bullish structure and shift bias bearish.
3. Fair Value Gap (FVG) Context
The highlighted FVG above current price indicates:
A liquidity inefficiency left during prior bearish impulse.
Potential magnet for price.
Confluence with resistance flip zone.
Markets often retrace into these inefficiencies before continuation.
4. Trade Scenario (Bullish Bias)
Entry Concept:
Acceptance above 68,500 with confirmation (strong close + continuation).
Target:
Retest of 71,500 – 72,000 (main resistance liquidity zone).
Invalidation:
Sustained breakdown below 67,800 and especially below 65,000 support.
Risk Profile:
Favorable R:R if entering on confirmation rather than anticipation.
5. Order Flow & Momentum Insight
Selling pressure appears to be weakening.
Higher lows show buyer absorption.
Consolidation under resistance often precedes breakout.
Liquidity is resting above 72K — attractive for market makers.
6. Probability Outlook
Current bias: Moderately Bullish (60–65%)
Conditions required:
Clean hold above 68.5K
Increasing bullish momentum candles
No sharp rejection from FVG zone
Failure to hold 68.5K would shift the setup into continued range-bound chop.
⚠️ Educational Disclaimer
This analysis is provided strictly for educational and informational purposes only.
ปิดการเทรด: ถึงเป้าหมายการตัดขาดทุน

การนำเสนอที่เกี่ยวข้อง
คำจำกัดสิทธิ์ความรับผิดชอบ
ข้อมูลและบทความไม่ได้มีวัตถุประสงค์เพื่อก่อให้เกิดกิจกรรมทางการเงิน, การลงทุน, การซื้อขาย, ข้อเสนอแนะ หรือคำแนะนำประเภทอื่น ๆ ที่ให้หรือรับรองโดย TradingView อ่านเพิ่มเติมใน ข้อกำหนดการใช้งาน
การนำเสนอที่เกี่ยวข้อง
คำจำกัดสิทธิ์ความรับผิดชอบ
ข้อมูลและบทความไม่ได้มีวัตถุประสงค์เพื่อก่อให้เกิดกิจกรรมทางการเงิน, การลงทุน, การซื้อขาย, ข้อเสนอแนะ หรือคำแนะนำประเภทอื่น ๆ ที่ให้หรือรับรองโดย TradingView อ่านเพิ่มเติมใน ข้อกำหนดการใช้งาน