
#BTC/USD
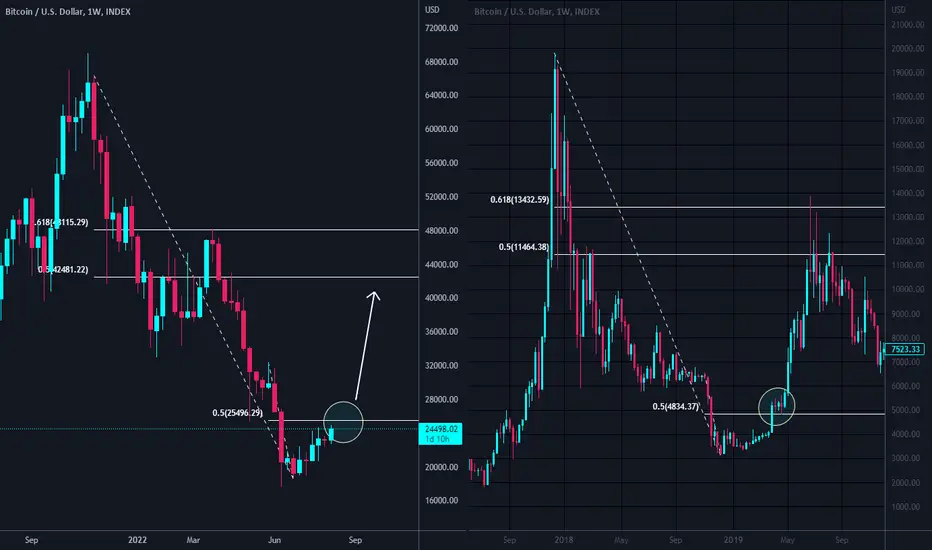
 BTC #Fractal from swing low of first of 2019.
⚡️ If BTC closes a weekly candle above 0.5 fib level of last daily swing low, like the swing of 2019 I showed in the chart, price may have repeat that fractal and rise toward 0.5 fib level of the whole swing down around $42k
If you use "Bars Pattern" tool you can understand the similarities better.
BTC #Fractal from swing low of first of 2019.⚡️ If BTC closes a weekly candle above 0.5 fib level of last daily swing low, like the swing of 2019 I showed in the chart, price may have repeat that fractal and rise toward 0.5 fib level of the whole swing down around $42k
If you use "Bars Pattern" tool you can understand the similarities better.

การนำเสนอที่เกี่ยวข้อง
คำจำกัดสิทธิ์ความรับผิดชอบ
ข้อมูลและบทความไม่ได้มีวัตถุประสงค์เพื่อก่อให้เกิดกิจกรรมทางการเงิน, การลงทุน, การซื้อขาย, ข้อเสนอแนะ หรือคำแนะนำประเภทอื่น ๆ ที่ให้หรือรับรองโดย TradingView อ่านเพิ่มเติมใน ข้อกำหนดการใช้งาน
การนำเสนอที่เกี่ยวข้อง
คำจำกัดสิทธิ์ความรับผิดชอบ
ข้อมูลและบทความไม่ได้มีวัตถุประสงค์เพื่อก่อให้เกิดกิจกรรมทางการเงิน, การลงทุน, การซื้อขาย, ข้อเสนอแนะ หรือคำแนะนำประเภทอื่น ๆ ที่ให้หรือรับรองโดย TradingView อ่านเพิ่มเติมใน ข้อกำหนดการใช้งาน