
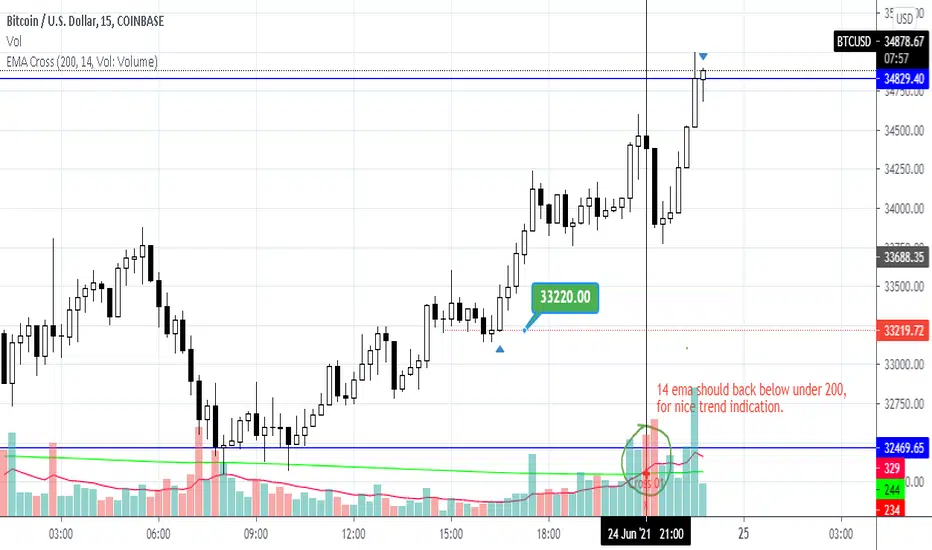
Bullish rally started at the price of 33220, heavy volume came at that point, and
it could be strong support, now price is near Resistance 34830, which served as
a strong resistance historically, so sort setup could possibility at this point.
Here using double EMA indicator on volume, could provide indication to end of
trend,where 14 period EMA on 5 min time frame chart crossed 200 EMA same period.
Sort setup possible at Resistance level.
!Strong close above 34830 should be bullish move.
Technical- Based on Support/Resistance:
- Strong Suport: 33220
- Strong Resistance: 34830
! Here I'm trying to understand double EMA indicator on volume chart, looking for more content.
Image-
it could be strong support, now price is near Resistance 34830, which served as
a strong resistance historically, so sort setup could possibility at this point.
Here using double EMA indicator on volume, could provide indication to end of
trend,where 14 period EMA on 5 min time frame chart crossed 200 EMA same period.
Sort setup possible at Resistance level.
!Strong close above 34830 should be bullish move.
Technical- Based on Support/Resistance:
- Strong Suport: 33220
- Strong Resistance: 34830
! Here I'm trying to understand double EMA indicator on volume chart, looking for more content.
Image-
ปิดการเทรด: ถึงเป้าหมายการตัดขาดทุน
Broke above.บันทึก
Back to selling territory, EMA under 200. It touched 35250 resistance level, (old post)
บันทึก
Level 35250, good resistance
คำจำกัดสิทธิ์ความรับผิดชอบ
ข้อมูลและบทความไม่ได้มีวัตถุประสงค์เพื่อก่อให้เกิดกิจกรรมทางการเงิน, การลงทุน, การซื้อขาย, ข้อเสนอแนะ หรือคำแนะนำประเภทอื่น ๆ ที่ให้หรือรับรองโดย TradingView อ่านเพิ่มเติมใน ข้อกำหนดการใช้งาน
คำจำกัดสิทธิ์ความรับผิดชอบ
ข้อมูลและบทความไม่ได้มีวัตถุประสงค์เพื่อก่อให้เกิดกิจกรรมทางการเงิน, การลงทุน, การซื้อขาย, ข้อเสนอแนะ หรือคำแนะนำประเภทอื่น ๆ ที่ให้หรือรับรองโดย TradingView อ่านเพิ่มเติมใน ข้อกำหนดการใช้งาน