
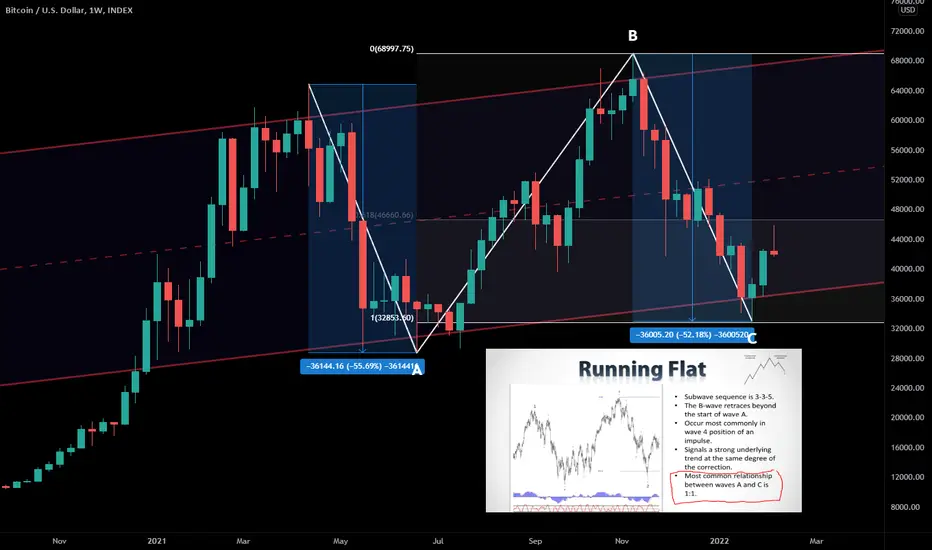
Bitcoin's running flat correction appears to be a textbook example, in looking at our weekly chart thus far:
- Wave B traced beyond the start of Wave A -- higher high, higher low for Wave C
- Wave C stopped exactly at the 100% of our trend-based fib measured from 0 -> A -> B, and not as low as the start of Wave A -- looking like we found our bottom here
- Wave A moved 36.1k, Wave C moved 36k, and the most common relationship between Waves A and C in a running flat are 1 : 1 -- this is incredibly close to 1:1
Related idea linked below.
- Wave B traced beyond the start of Wave A -- higher high, higher low for Wave C
- Wave C stopped exactly at the 100% of our trend-based fib measured from 0 -> A -> B, and not as low as the start of Wave A -- looking like we found our bottom here
- Wave A moved 36.1k, Wave C moved 36k, and the most common relationship between Waves A and C in a running flat are 1 : 1 -- this is incredibly close to 1:1
Related idea linked below.
บันทึก
Zoomed out view, to see the actual values on the measures:บันทึก
Update, line chart still hasn't reached 100% fib extension on the daily, this could be us heading towards the end of wave 5, would want to see a strong reaction at the 100% and the bottom of this channel:บันทึก
That would be a low on the daily around 33k give or take 500
การนำเสนอที่เกี่ยวข้อง
คำจำกัดสิทธิ์ความรับผิดชอบ
ข้อมูลและบทความไม่ได้มีวัตถุประสงค์เพื่อก่อให้เกิดกิจกรรมทางการเงิน, การลงทุน, การซื้อขาย, ข้อเสนอแนะ หรือคำแนะนำประเภทอื่น ๆ ที่ให้หรือรับรองโดย TradingView อ่านเพิ่มเติมใน ข้อกำหนดการใช้งาน
การนำเสนอที่เกี่ยวข้อง
คำจำกัดสิทธิ์ความรับผิดชอบ
ข้อมูลและบทความไม่ได้มีวัตถุประสงค์เพื่อก่อให้เกิดกิจกรรมทางการเงิน, การลงทุน, การซื้อขาย, ข้อเสนอแนะ หรือคำแนะนำประเภทอื่น ๆ ที่ให้หรือรับรองโดย TradingView อ่านเพิ่มเติมใน ข้อกำหนดการใช้งาน