
Simple and to the point.
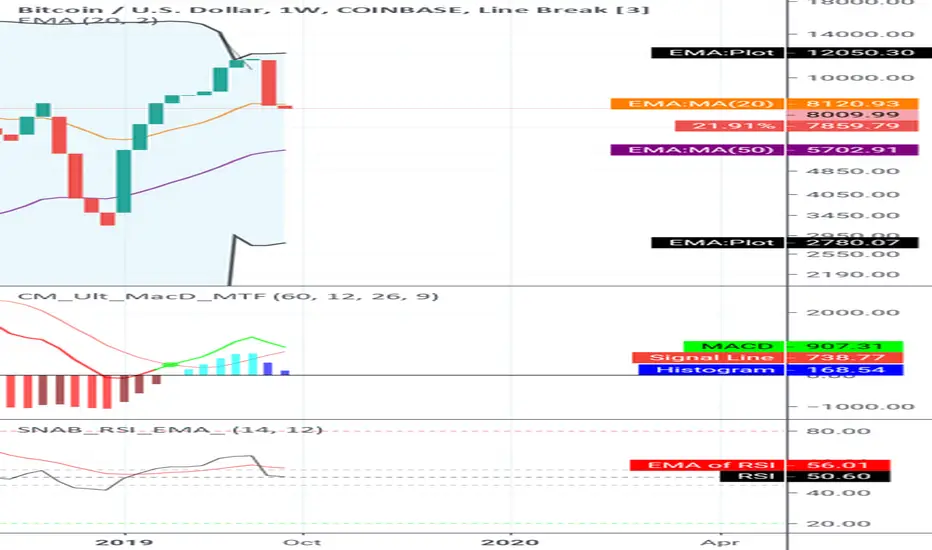
1.Currently we are sitting within the $8000 range
2. 20 day moving average of $8120 is acting as strong resistance
3. Bearish sentiment has set in on the MACD and RSI
4. As of right now Next level of support is looking to be $7850
5. Failure to hold $7850 could see a further decline to the 50 day moving average of $5700
6. Possibly within the next 3 to 6 weeks another selloff will occur.
7. Based on current trend, I'm looking for a buy in around February or March of 2020
1.Currently we are sitting within the $8000 range
2. 20 day moving average of $8120 is acting as strong resistance
3. Bearish sentiment has set in on the MACD and RSI
4. As of right now Next level of support is looking to be $7850
5. Failure to hold $7850 could see a further decline to the 50 day moving average of $5700
6. Possibly within the next 3 to 6 weeks another selloff will occur.
7. Based on current trend, I'm looking for a buy in around February or March of 2020
บันทึก
Currently sitting above the 20 day moving average resistance of $8120 on the weekly line break chart, however my outlook is still bearish. I don't believe $8000 will hold I'm bearish for further decline in the weeks to come.
บันทึก
Get ready for a test to $7500
บันทึก
Called that oneบันทึก
Sitting at $7500 levelsบันทึก
Get ready for $7000บันทึก
Drop to $7000 should occur roughly within the weekบันทึก
expect sideways trading between 8K and 9.5K until halving 2020
คำจำกัดสิทธิ์ความรับผิดชอบ
ข้อมูลและบทความไม่ได้มีวัตถุประสงค์เพื่อก่อให้เกิดกิจกรรมทางการเงิน, การลงทุน, การซื้อขาย, ข้อเสนอแนะ หรือคำแนะนำประเภทอื่น ๆ ที่ให้หรือรับรองโดย TradingView อ่านเพิ่มเติมใน ข้อกำหนดการใช้งาน
คำจำกัดสิทธิ์ความรับผิดชอบ
ข้อมูลและบทความไม่ได้มีวัตถุประสงค์เพื่อก่อให้เกิดกิจกรรมทางการเงิน, การลงทุน, การซื้อขาย, ข้อเสนอแนะ หรือคำแนะนำประเภทอื่น ๆ ที่ให้หรือรับรองโดย TradingView อ่านเพิ่มเติมใน ข้อกำหนดการใช้งาน