
There are so many tools to use when trying to identify Bitcoin Bear signals and markers.
But it is actually not really that complicated.
All you need are 2 SMA's and the RSI
Lets Get in
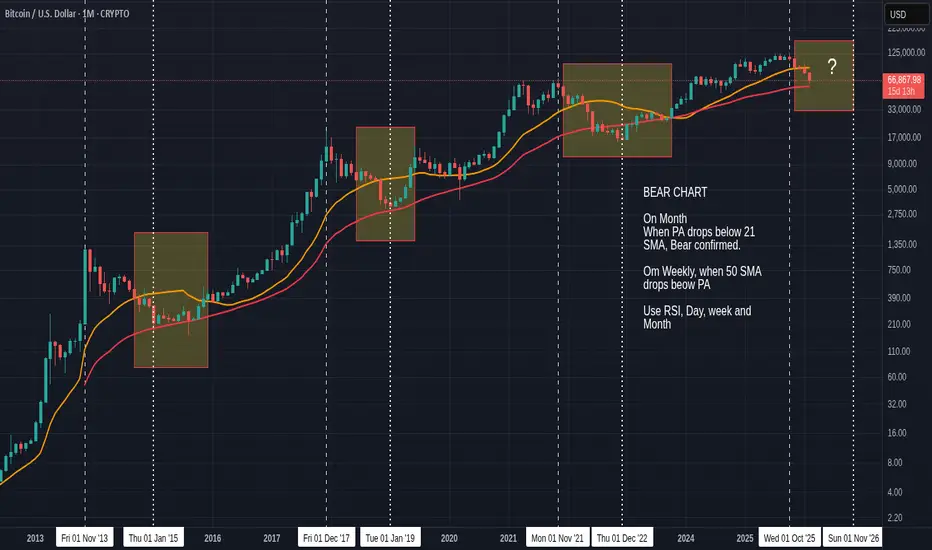
On the chart above...
21 SMA - Orange
50 SMA - Red
On a monthly chart, Above, When that 21 SMA drops below PA, THAT is the Confirmation of a Bear.
On a Weekly chart. It is the 50 SMA that Gives the First signal...When that drops below PA, start looking at the monthly chart.
The Boxes on the chart are started off a Weekly chart.
On a Month Chart, Note how that 50 SMA acts as support, usually. This is the "Bottom Zone Marker"
It will be the 200 SMA on a Weeklu chart.
So, there we are,,,,simple identifiers to see the Start and the possible Low off a Bear market.
What about the End ?
That is next to impossible..................However, the RSI can show us historical data that we should not ignore.
Before we look at the RSI, Go back and look at the Main chart. Take Note of the Vertical Dashed lines, Off ATH and then the Vertical Dotted lines.
The Monthly RSI is invaluable.
The Vertical Dotted lines are the LOW point of the RSI draw down.
And as we can see, this does NOT always indicate the End of the Bear But the turning point of the RSI.
Something very interesting is how the Day count from ATH to the RSI low point was the same after 2017 and 2021.
If we use that same day number now, Does that mean we can expect tp wait till November this year ?
NO - Maybe, Impossible to say
But what Is very interesting now..is that Horizontal line that RSI has bounced off previously.
We have reached that point SO FAST.
Will that momentum continue and fall below that line , as in 2022 ?
Again, impossible to say but this needs to be watched.
So, Quick look back at main chart
Look at those Dotted lines again, the Low point of the RSI.
While Not the End of the Bear, officially, There Was a Range or a Rise in Price from these points...The BOTTOM was identified.
And we could be there NOW>.....
Personalty, I think a Range is more likely for a while but we may see a push higher for the Spring Push but statisticaly, that may not happen till Mid March / April
On a monthly Candle Close Color count.,
Feb has 10 Green to 4 Red - going to be hard to get a Green this time.
March has 6 Green to 8 Red
April has 9 Green to 5 Red
So, all we can do is wait.....
For now, I am assuming we are on or near the Bottom unless something Stupid happens in the eworld...
So, I buy Sats, amd Wait......................Cautiously

Nothing to be taken as Financial advice.
I will always say
"Only invest what you can afford to loose. When you are ready, take out your original investment. This way, it is only your profit that is at risk"
THAT is Financial advice
I will always say
"Only invest what you can afford to loose. When you are ready, take out your original investment. This way, it is only your profit that is at risk"
THAT is Financial advice
คำจำกัดสิทธิ์ความรับผิดชอบ
ข้อมูลและบทความไม่ได้มีวัตถุประสงค์เพื่อก่อให้เกิดกิจกรรมทางการเงิน, การลงทุน, การซื้อขาย, ข้อเสนอแนะ หรือคำแนะนำประเภทอื่น ๆ ที่ให้หรือรับรองโดย TradingView อ่านเพิ่มเติมใน ข้อกำหนดการใช้งาน
Nothing to be taken as Financial advice.
I will always say
"Only invest what you can afford to loose. When you are ready, take out your original investment. This way, it is only your profit that is at risk"
THAT is Financial advice
I will always say
"Only invest what you can afford to loose. When you are ready, take out your original investment. This way, it is only your profit that is at risk"
THAT is Financial advice
คำจำกัดสิทธิ์ความรับผิดชอบ
ข้อมูลและบทความไม่ได้มีวัตถุประสงค์เพื่อก่อให้เกิดกิจกรรมทางการเงิน, การลงทุน, การซื้อขาย, ข้อเสนอแนะ หรือคำแนะนำประเภทอื่น ๆ ที่ให้หรือรับรองโดย TradingView อ่านเพิ่มเติมใน ข้อกำหนดการใช้งาน