
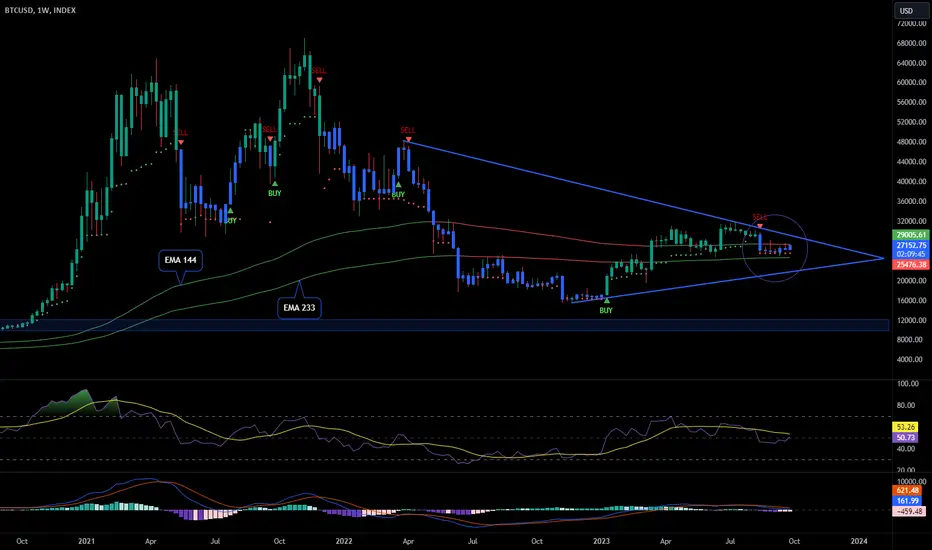
- Sell Signal Below Resistance Trend Line
- Squeeze between EMA 144 and 233
- RSI Picking Up
- MACD Neutral/Descending
Looking back to 2020 we can see a similar pattern.
What this mean?!?....
Well, it can repeat the same pattern that seems more sensible to me or in case of breaking the EMA 233 we will see a continuation of the downtrend towards the $10,000 region.
It was like this throughout September, squeeze between the two EMAs.
We will definitely have a lot of volatility this month and perhaps until the end of the year.
- Squeeze between EMA 144 and 233
- RSI Picking Up
- MACD Neutral/Descending
Looking back to 2020 we can see a similar pattern.
What this mean?!?....
Well, it can repeat the same pattern that seems more sensible to me or in case of breaking the EMA 233 we will see a continuation of the downtrend towards the $10,000 region.
It was like this throughout September, squeeze between the two EMAs.
We will definitely have a lot of volatility this month and perhaps until the end of the year.

คำจำกัดสิทธิ์ความรับผิดชอบ
ข้อมูลและบทความไม่ได้มีวัตถุประสงค์เพื่อก่อให้เกิดกิจกรรมทางการเงิน, การลงทุน, การซื้อขาย, ข้อเสนอแนะ หรือคำแนะนำประเภทอื่น ๆ ที่ให้หรือรับรองโดย TradingView อ่านเพิ่มเติมใน ข้อกำหนดการใช้งาน
คำจำกัดสิทธิ์ความรับผิดชอบ
ข้อมูลและบทความไม่ได้มีวัตถุประสงค์เพื่อก่อให้เกิดกิจกรรมทางการเงิน, การลงทุน, การซื้อขาย, ข้อเสนอแนะ หรือคำแนะนำประเภทอื่น ๆ ที่ให้หรือรับรองโดย TradingView อ่านเพิ่มเติมใน ข้อกำหนดการใช้งาน