
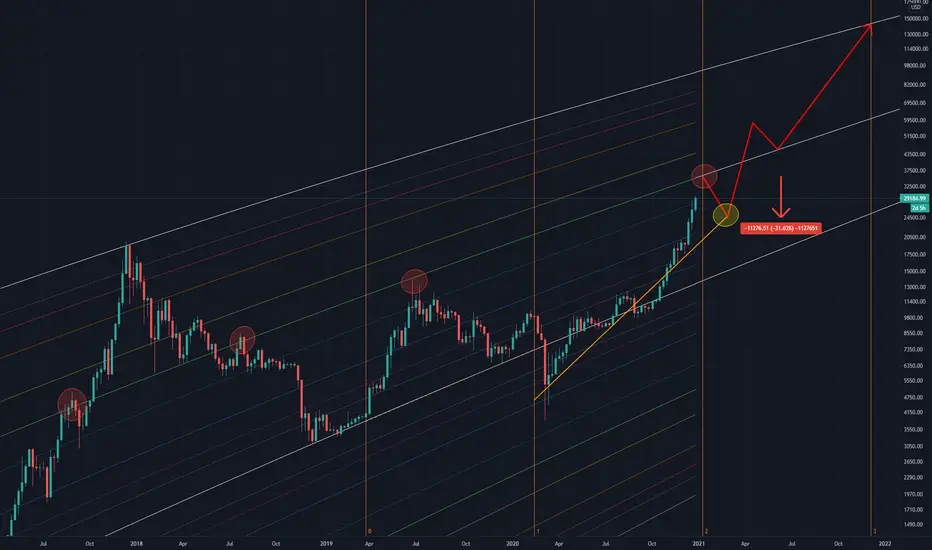
Every bitcoin bullrun so far has had pullbacks ,will history repeat itself, at this point we cant deny the fact the stock to flow model is still intact .
lookintobitcoin.com/charts/stock-to-flow-model/
So everything is setting up what looks to be the first pullback of this rally , as you can see we are coming up to very strong Fibonacci log band , this log band has a history of extreme resistance and volatility (Red circles ).
A pullback of 30% would bring the price down to about 24400 Dollars which would close the CME gap created that that price , all CME gaps get closed so at one point if you look back at the charts. (Yellow Circle)
The month of January is historical bitcoins worst preforming month.
lookintobitcoin.com/charts/stock-to-flow-model/
So everything is setting up what looks to be the first pullback of this rally , as you can see we are coming up to very strong Fibonacci log band , this log band has a history of extreme resistance and volatility (Red circles ).
A pullback of 30% would bring the price down to about 24400 Dollars which would close the CME gap created that that price , all CME gaps get closed so at one point if you look back at the charts. (Yellow Circle)
The month of January is historical bitcoins worst preforming month.

คำจำกัดสิทธิ์ความรับผิดชอบ
ข้อมูลและบทความไม่ได้มีวัตถุประสงค์เพื่อก่อให้เกิดกิจกรรมทางการเงิน, การลงทุน, การซื้อขาย, ข้อเสนอแนะ หรือคำแนะนำประเภทอื่น ๆ ที่ให้หรือรับรองโดย TradingView อ่านเพิ่มเติมใน ข้อกำหนดการใช้งาน
คำจำกัดสิทธิ์ความรับผิดชอบ
ข้อมูลและบทความไม่ได้มีวัตถุประสงค์เพื่อก่อให้เกิดกิจกรรมทางการเงิน, การลงทุน, การซื้อขาย, ข้อเสนอแนะ หรือคำแนะนำประเภทอื่น ๆ ที่ให้หรือรับรองโดย TradingView อ่านเพิ่มเติมใน ข้อกำหนดการใช้งาน