
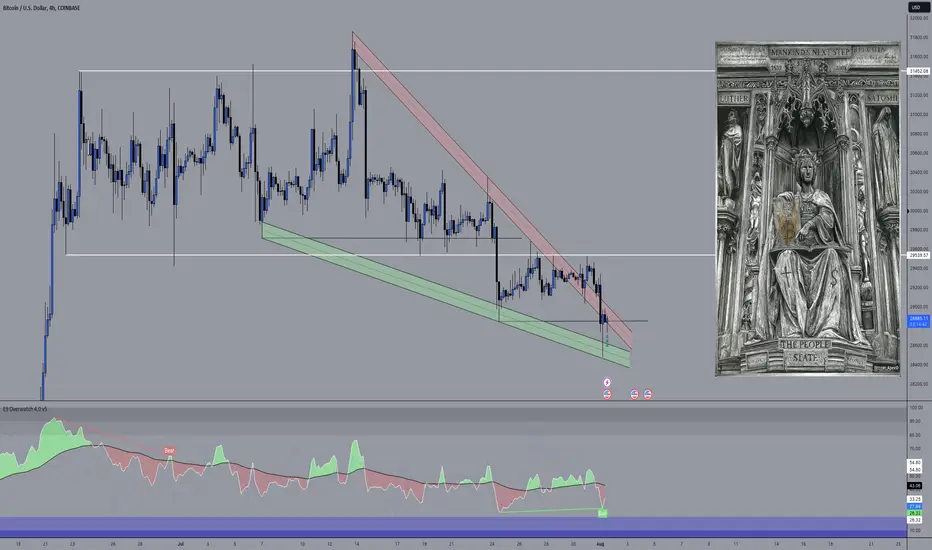
Bitcoin falling wedge pattern on the higher timeframe charts looks good...
context: has moved up into new territories around 30k and has tried to push higher but failed, being stuck within range bound trading, we have seen the range get traded many times, now we have a small dip below the lower end of the range aswell as falling wedge pattern which signals a continuation pattern.
Hopefully we will see this wedge break to the upside, retest and move back into our range.
Will update with other confluences within the comments section.
บันทึก
Breakout of wedge.... would like to see the previous range recaptured... บันทึก
Getting close... ปิดการเทรด: ถึงเป้าหมายการทำกำไร
was a lovely entry... OVERWATCH doing the business here... we are back in range once again... will close this idea moving forwards... 
การนำเสนอที่เกี่ยวข้อง
คำจำกัดสิทธิ์ความรับผิดชอบ
ข้อมูลและบทความไม่ได้มีวัตถุประสงค์เพื่อก่อให้เกิดกิจกรรมทางการเงิน, การลงทุน, การซื้อขาย, ข้อเสนอแนะ หรือคำแนะนำประเภทอื่น ๆ ที่ให้หรือรับรองโดย TradingView อ่านเพิ่มเติมใน ข้อกำหนดการใช้งาน
การนำเสนอที่เกี่ยวข้อง
คำจำกัดสิทธิ์ความรับผิดชอบ
ข้อมูลและบทความไม่ได้มีวัตถุประสงค์เพื่อก่อให้เกิดกิจกรรมทางการเงิน, การลงทุน, การซื้อขาย, ข้อเสนอแนะ หรือคำแนะนำประเภทอื่น ๆ ที่ให้หรือรับรองโดย TradingView อ่านเพิ่มเติมใน ข้อกำหนดการใช้งาน