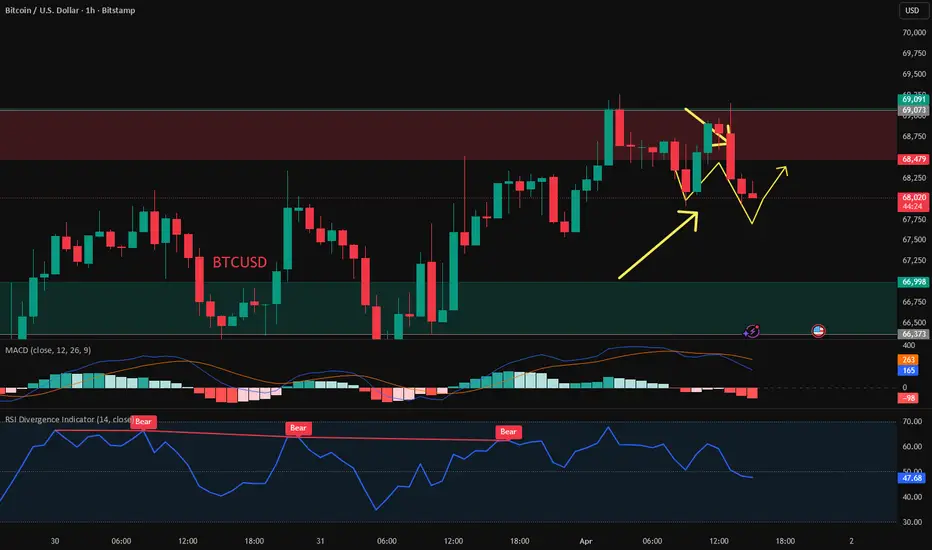
The 4-hour technical indicators are bullish, and there is still momentum for the price to test the $70,000 level in the short term. However, the daily chart shows a continued downtrend, with significant resistance in the $70,000-$72,600 range, and insufficient trading volume limiting the potential for a rebound. Short-term traders may consider taking a small long position in the $67,000-$67,500 range, or shorting in the $69,800-$70,200 range to profit from a pullback. The current rebound is still characterized as a technical correction rather than a trend reversal.
 BTCUSD BTCUSD BTC1! BTCUSD
BTCUSD BTCUSD BTC1! BTCUSD 
คำจำกัดสิทธิ์ความรับผิดชอบ
ข้อมูลและบทความไม่ได้มีวัตถุประสงค์เพื่อก่อให้เกิดกิจกรรมทางการเงิน, การลงทุน, การซื้อขาย, ข้อเสนอแนะ หรือคำแนะนำประเภทอื่น ๆ ที่ให้หรือรับรองโดย TradingView อ่านเพิ่มเติมใน ข้อกำหนดการใช้งาน
คำจำกัดสิทธิ์ความรับผิดชอบ
ข้อมูลและบทความไม่ได้มีวัตถุประสงค์เพื่อก่อให้เกิดกิจกรรมทางการเงิน, การลงทุน, การซื้อขาย, ข้อเสนอแนะ หรือคำแนะนำประเภทอื่น ๆ ที่ให้หรือรับรองโดย TradingView อ่านเพิ่มเติมใน ข้อกำหนดการใช้งาน