
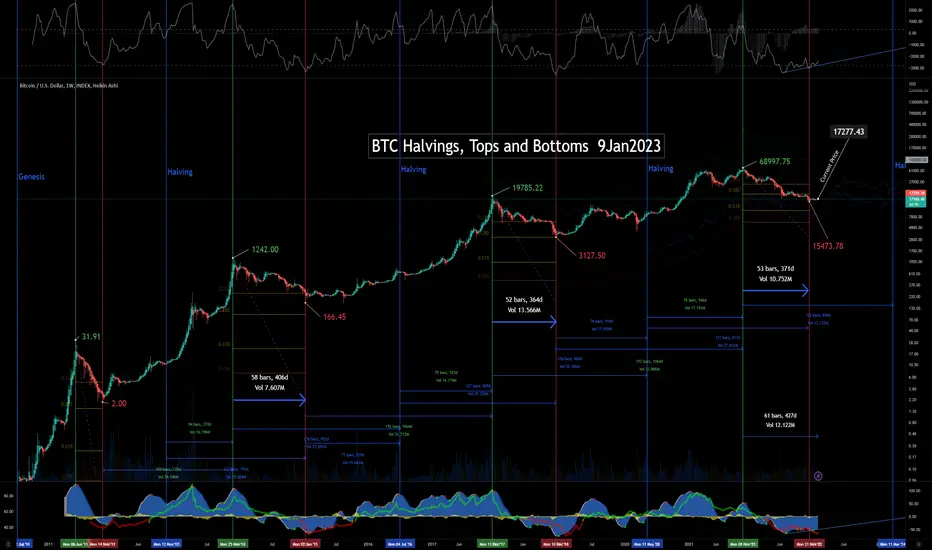
Latest update of an X-axis chart. Prices labeled for all cycle tops and bottoms. Dates marked for tops, bottoms and halvings.
Could easily see a 2x of previous ATH in 2025. Expecting slow trend upward with volatility increasing into the halving/ Fed pivot, then a parabolic 5-wave run up above 100k in 2025.
This version also includes time measurements of relevant cycle relationships.
Could easily see a 2x of previous ATH in 2025. Expecting slow trend upward with volatility increasing into the halving/ Fed pivot, then a parabolic 5-wave run up above 100k in 2025.
This version also includes time measurements of relevant cycle relationships.

คำจำกัดสิทธิ์ความรับผิดชอบ
ข้อมูลและบทความไม่ได้มีวัตถุประสงค์เพื่อก่อให้เกิดกิจกรรมทางการเงิน, การลงทุน, การซื้อขาย, ข้อเสนอแนะ หรือคำแนะนำประเภทอื่น ๆ ที่ให้หรือรับรองโดย TradingView อ่านเพิ่มเติมใน ข้อกำหนดการใช้งาน
คำจำกัดสิทธิ์ความรับผิดชอบ
ข้อมูลและบทความไม่ได้มีวัตถุประสงค์เพื่อก่อให้เกิดกิจกรรมทางการเงิน, การลงทุน, การซื้อขาย, ข้อเสนอแนะ หรือคำแนะนำประเภทอื่น ๆ ที่ให้หรือรับรองโดย TradingView อ่านเพิ่มเติมใน ข้อกำหนดการใช้งาน