
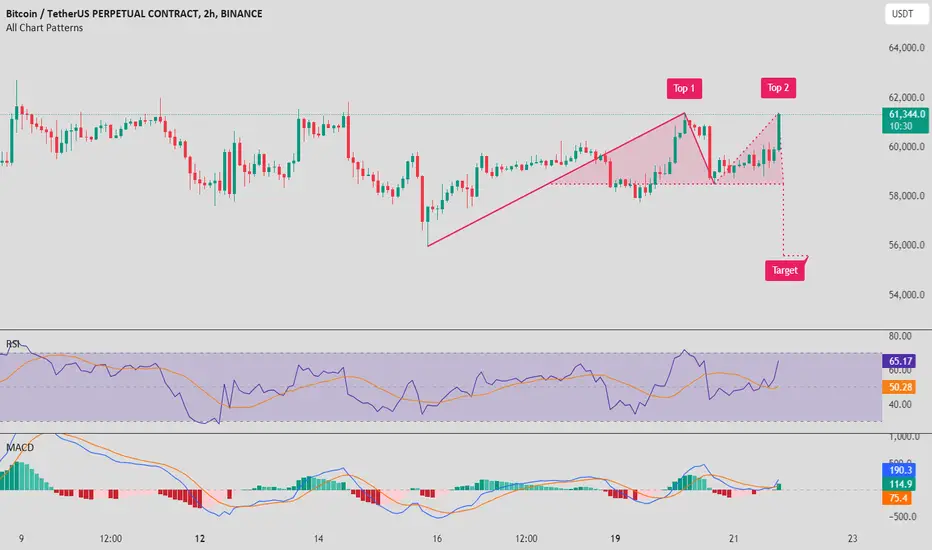
It looks like Bitcoin has formed a rising wedge pattern on the 2-hour chart, which typically indicates a potential bearish reversal. The pattern has already reached its second top, and the price seems to be breaking down from the wedge. The target for this breakdown could be around $56,000, which aligns with the support zone from earlier price action. The RSI is near overbought territory, suggesting that the momentum might be fading, and the MACD is showing early signs of a bearish crossover. Keep an eye on the volume to confirm this breakdown; if it picks up, we might see a sharper decline.

คำจำกัดสิทธิ์ความรับผิดชอบ
ข้อมูลและบทความไม่ได้มีวัตถุประสงค์เพื่อก่อให้เกิดกิจกรรมทางการเงิน, การลงทุน, การซื้อขาย, ข้อเสนอแนะ หรือคำแนะนำประเภทอื่น ๆ ที่ให้หรือรับรองโดย TradingView อ่านเพิ่มเติมใน ข้อกำหนดการใช้งาน
คำจำกัดสิทธิ์ความรับผิดชอบ
ข้อมูลและบทความไม่ได้มีวัตถุประสงค์เพื่อก่อให้เกิดกิจกรรมทางการเงิน, การลงทุน, การซื้อขาย, ข้อเสนอแนะ หรือคำแนะนำประเภทอื่น ๆ ที่ให้หรือรับรองโดย TradingView อ่านเพิ่มเติมใน ข้อกำหนดการใช้งาน