
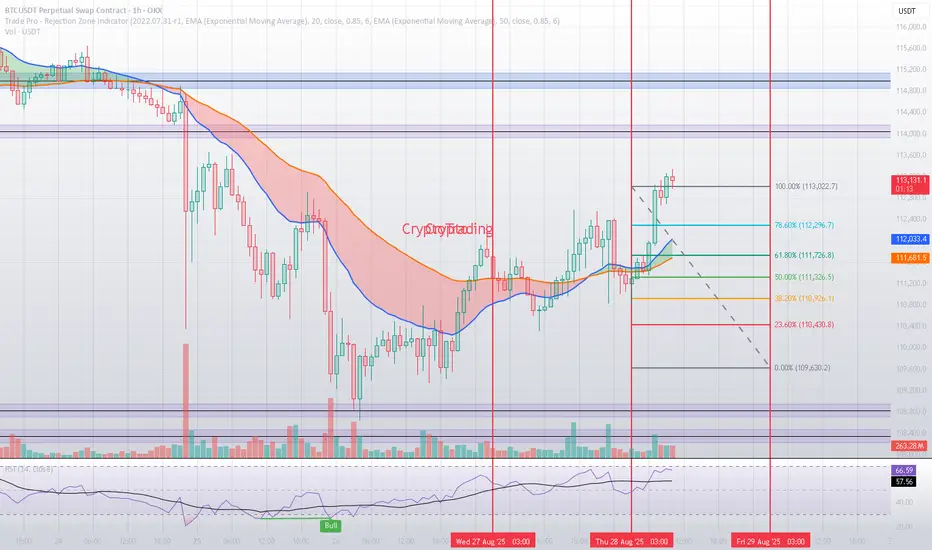
Based on mathematical and statistical models, along with Fibonacci retracement levels and moving averages, Bitcoin is currently trading near the $113,000 area. The recent bullish momentum has pushed the price upward, but the market now faces key pivot levels that will determine the next move.
🔹 Key Resistance Levels
$114,047.7: The first major resistance. A clear breakout above this level could fuel further bullish momentum. 🚀
$114,995.1: A critical resistance both technically and psychologically. Surpassing this level would likely open the way towards $115,800 – $116,000, confirming the strength of the current uptrend.
🔹 Major Support Levels
$108,829: A crucial support zone. If broken, short-term market sentiment may shift from bullish to neutral. 🛡️
$108,349: A stronger support level. A breakdown here could trigger a move toward $107,000 or even lower.
📈 Indicator Insights
The RSI is hovering near 66, suggesting the market is gradually entering overbought territory. This highlights the importance of the resistance zones, where profit-taking could occur.
The 20 & 50 EMA lines are showing a bullish crossover, supporting upward momentum as long as support levels hold.
🟢 Bullish Scenario
If the price breaks above $114,047.7 and then $114,995.1, Bitcoin could quickly advance toward $115,800 – $116,000 in the short term.
🔴 Bearish Scenario
Failure to sustain above $113,000 could lead to a pullback, with $108,829 as the first line of defense, followed by the stronger support at $108,349. A breakdown below this zone would turn the short-term outlook bearish.
✅ Conclusion
Bitcoin is at a decisive point: strong resistance lies between $114K – $115K, while robust supports are clustered near $108K. A breakout or breakdown from these levels will set the tone for the next major move. Until then, risk management remains essential. ⚖️
🔹 Key Resistance Levels
$114,047.7: The first major resistance. A clear breakout above this level could fuel further bullish momentum. 🚀
$114,995.1: A critical resistance both technically and psychologically. Surpassing this level would likely open the way towards $115,800 – $116,000, confirming the strength of the current uptrend.
🔹 Major Support Levels
$108,829: A crucial support zone. If broken, short-term market sentiment may shift from bullish to neutral. 🛡️
$108,349: A stronger support level. A breakdown here could trigger a move toward $107,000 or even lower.
📈 Indicator Insights
The RSI is hovering near 66, suggesting the market is gradually entering overbought territory. This highlights the importance of the resistance zones, where profit-taking could occur.
The 20 & 50 EMA lines are showing a bullish crossover, supporting upward momentum as long as support levels hold.
🟢 Bullish Scenario
If the price breaks above $114,047.7 and then $114,995.1, Bitcoin could quickly advance toward $115,800 – $116,000 in the short term.
🔴 Bearish Scenario
Failure to sustain above $113,000 could lead to a pullback, with $108,829 as the first line of defense, followed by the stronger support at $108,349. A breakdown below this zone would turn the short-term outlook bearish.
✅ Conclusion
Bitcoin is at a decisive point: strong resistance lies between $114K – $115K, while robust supports are clustered near $108K. A breakout or breakdown from these levels will set the tone for the next major move. Until then, risk management remains essential. ⚖️
บันทึก
💡 Important NoteBitcoin is currently trading above the 100% Fibonacci level and above $113,022.7, which is a strong indicator of bullish momentum 🚀.
However, caution is required ⚠️ — at these levels, the market may be entering a FOMO trap. Within just 2 to 5 minutes, we could see a sharp pullback to lower levels.
Please exercise extra caution and apply strict risk management when trading around these critical zones. ⚖️

คำจำกัดสิทธิ์ความรับผิดชอบ
ข้อมูลและบทความไม่ได้มีวัตถุประสงค์เพื่อก่อให้เกิดกิจกรรมทางการเงิน, การลงทุน, การซื้อขาย, ข้อเสนอแนะ หรือคำแนะนำประเภทอื่น ๆ ที่ให้หรือรับรองโดย TradingView อ่านเพิ่มเติมใน ข้อกำหนดการใช้งาน
คำจำกัดสิทธิ์ความรับผิดชอบ
ข้อมูลและบทความไม่ได้มีวัตถุประสงค์เพื่อก่อให้เกิดกิจกรรมทางการเงิน, การลงทุน, การซื้อขาย, ข้อเสนอแนะ หรือคำแนะนำประเภทอื่น ๆ ที่ให้หรือรับรองโดย TradingView อ่านเพิ่มเติมใน ข้อกำหนดการใช้งาน