
BTC: Optimizing a 64.6K Resistance Short With Volume Profile
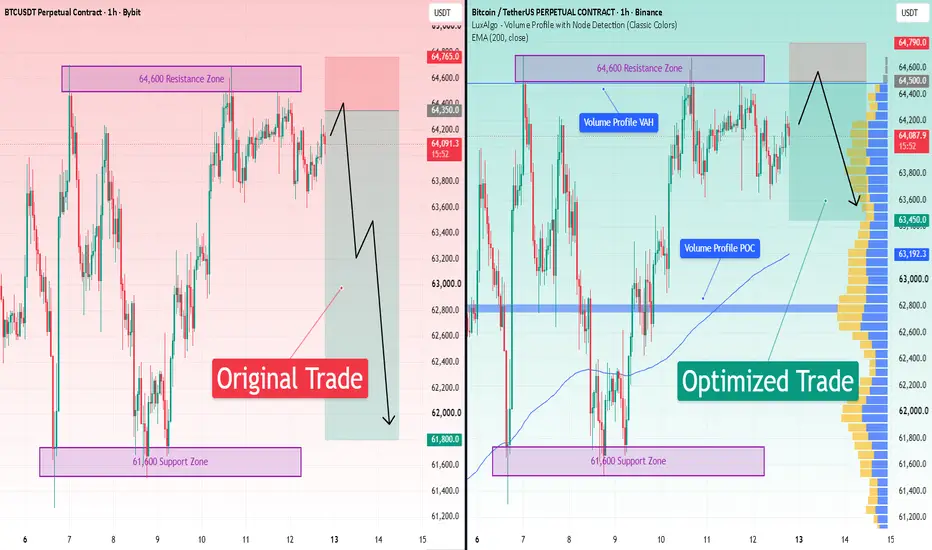
Today I am stress-testing a short setup based on catching a rejection off the 64.6K resistance zone. The original parameters proposed an entry at 64,350, a take-profit at 61,800, and a stop-loss at 64,765. My objective is to take this thesis and optimize the execution levels using Volume Profile, Market Structure, and Volatility metrics.
💡 IDEA
The original thesis suggested shorting a rejection off the 64.6K resistance zone to target a take-profit near the 61.6K support zone.
This approach relies on a minor pullback shattering the global 4-hour uptrend.
The optimized setup shifts the focus to shorting the test of the Value Area High and the 1-hour resistance block. The target is adjusted to sweep the recent structural low into the nearest uncontested 1-hour support zone.
🛫 ENTRY
The initial entry was marked at 64,350.
This placement front-runs the true liquidity pools.
The entry was moved to 64,500 to precisely capture the Value Area High at 64,483.9 and the minimum boundary of the 1-hour resistance zone at 64,497.4. This adjustment prevents missing the actual point of interest.
💰 TAKE-PROFIT
The original take-profit of 61,800 ignores major structural hurdles.
Reaching that depth requires price to slice through the volume Point of Control at 62,785 and the 1-hour EMA 200 at 63,182.
The take-profit was aggressively raised to 63,450.
This secures profits at the bottom of the next major 1-hour support zone spanning 63,450 to 63,619.9, strategically capturing the sweep of the recent trend extreme low at 63,602.8.
🛡️ STOP-LOSS
The initial stop-loss was placed at 64,765.
While structurally sound, it runs a minor risk of being swept before a reversal.
The stop-loss was shifted to 64,790.
By adding a 15-minute ATR buffer of 97.1 to the 1-hour resistance maximum of 64,691.9, the placement protects against localized volatility spikes while confirming structural invalidation if hit.
⚖️ RISK-TO-REWARD
The original setup projected a 1:6.14 risk-to-reward ratio.
This was a phantom metric based on a highly improbable outcome.
The optimized parameters yield a 1:3.62 ratio. This presents a structurally verifiable yield that heavily respects capital preservation parameters and localized market structure.
I will be tracking the charts to see which of these two setups performs better.
💡 IDEA
The original thesis suggested shorting a rejection off the 64.6K resistance zone to target a take-profit near the 61.6K support zone.
This approach relies on a minor pullback shattering the global 4-hour uptrend.
The optimized setup shifts the focus to shorting the test of the Value Area High and the 1-hour resistance block. The target is adjusted to sweep the recent structural low into the nearest uncontested 1-hour support zone.
🛫 ENTRY
The initial entry was marked at 64,350.
This placement front-runs the true liquidity pools.
The entry was moved to 64,500 to precisely capture the Value Area High at 64,483.9 and the minimum boundary of the 1-hour resistance zone at 64,497.4. This adjustment prevents missing the actual point of interest.
💰 TAKE-PROFIT
The original take-profit of 61,800 ignores major structural hurdles.
Reaching that depth requires price to slice through the volume Point of Control at 62,785 and the 1-hour EMA 200 at 63,182.
The take-profit was aggressively raised to 63,450.
This secures profits at the bottom of the next major 1-hour support zone spanning 63,450 to 63,619.9, strategically capturing the sweep of the recent trend extreme low at 63,602.8.
🛡️ STOP-LOSS
The initial stop-loss was placed at 64,765.
While structurally sound, it runs a minor risk of being swept before a reversal.
The stop-loss was shifted to 64,790.
By adding a 15-minute ATR buffer of 97.1 to the 1-hour resistance maximum of 64,691.9, the placement protects against localized volatility spikes while confirming structural invalidation if hit.
⚖️ RISK-TO-REWARD
The original setup projected a 1:6.14 risk-to-reward ratio.
This was a phantom metric based on a highly improbable outcome.
The optimized parameters yield a 1:3.62 ratio. This presents a structurally verifiable yield that heavily respects capital preservation parameters and localized market structure.
I will be tracking the charts to see which of these two setups performs better.
ออร์เดอร์ถูกยกเลิก
Sometimes the simplest setups win, as was the case here. The original idea reached a 3.9% take profit, while the optimized one was canceled because it didn't reach the entry level.
🤖 I optimize my trade setups with this AI Telegram bot (EN/RU):
🔗 t.me/sharkcouncil_bot
🔗 t.me/sharkcouncil_bot
คำจำกัดสิทธิ์ความรับผิดชอบ
ข้อมูลและบทความไม่ได้มีวัตถุประสงค์เพื่อก่อให้เกิดกิจกรรมทางการเงิน, การลงทุน, การซื้อขาย, ข้อเสนอแนะ หรือคำแนะนำประเภทอื่น ๆ ที่ให้หรือรับรองโดย TradingView อ่านเพิ่มเติมใน ข้อกำหนดการใช้งาน
🤖 I optimize my trade setups with this AI Telegram bot (EN/RU):
🔗 t.me/sharkcouncil_bot
🔗 t.me/sharkcouncil_bot
คำจำกัดสิทธิ์ความรับผิดชอบ
ข้อมูลและบทความไม่ได้มีวัตถุประสงค์เพื่อก่อให้เกิดกิจกรรมทางการเงิน, การลงทุน, การซื้อขาย, ข้อเสนอแนะ หรือคำแนะนำประเภทอื่น ๆ ที่ให้หรือรับรองโดย TradingView อ่านเพิ่มเติมใน ข้อกำหนดการใช้งาน