BTCUSDT 3S: Butterfly Harmonic Pattern & Deep Crab Reversal
TR 
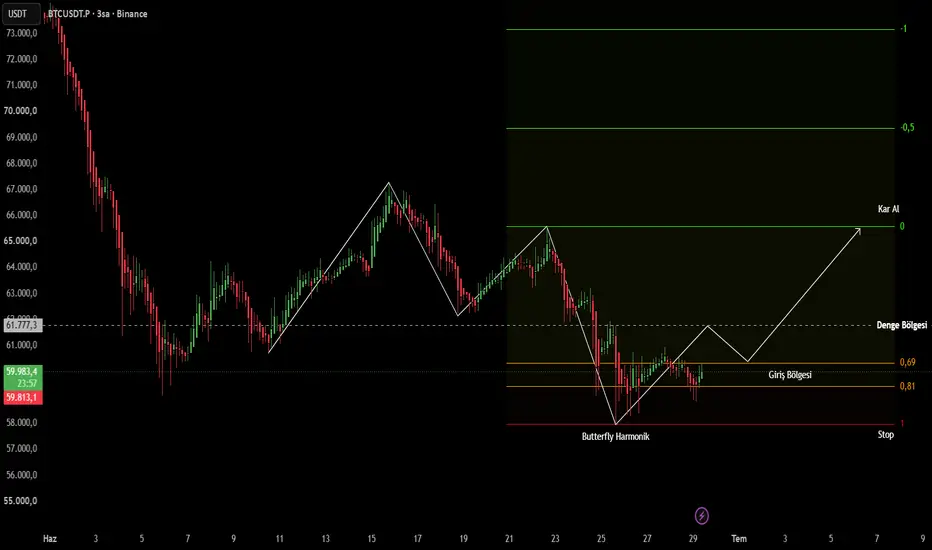
 BTCUSDT 3 saatlik grafikte düşüş trendinin son likidite alımının ardından fiyatın dip bölgede güçlü bir Butterfly (Kelebek) Harmonik Formasyonu oluşturduğu görülmektedir.
Fiyatın bu dipten başlattığı ilk tepki hareketinin ardından düzeltmesini yaptığı 0.69 - 0.81 Fibonacci optimizasyon bandı, long yönlü pozisyona dahil olmak için asimetrik bir risk/ödül oranı sunmaktadır. Formasyonun iptal seviyesi (1 çizgisi) stop kabul edilerek, üst taraftaki majör direnç yapısı hedeflenmiştir.
Giriş Alanı: 0.69 - 0.81 Kutusu
Stop-Loss: 1 Seviyesi altı (3S mum kapanışı)
Ana Hedef (TP): 65.500 (0 Seviyesi)
ENG Following the completion of the previous bearish expansion, BTCUSDT has tapped into a major HTF demand area on the 3-hour chart, printing a high-probability Butterfly Harmonic Pattern.
The initial reaction from the absolute bottom shows early signs of a trend reversal. The subsequent corrective pullback into our optimized entry window—the 0.69 - 0.81 Fibonacci retracement zone—provides an asymmetric risk-to-reward ratio (R:R > 1:4) for a long positioning.
While navigating this counter-trend setup, maintaining strict risk discipline remains paramount. The invalidation level is clearly defined just below the harmonic completion point.
Entry Zone: 0.69 - 0.81 Optimisation Box (Current Consolidation Area)
Stop-Loss: Just below Level 1 (Invalidation point on 3H close)
Take-Profit (TP): 65,500 (Level 0 / Major Supply & Equilibrium)
#bitcoin #btcusdt #harmonic #butterfly #long #priceaction
BTCUSDT 3 saatlik grafikte düşüş trendinin son likidite alımının ardından fiyatın dip bölgede güçlü bir Butterfly (Kelebek) Harmonik Formasyonu oluşturduğu görülmektedir.Fiyatın bu dipten başlattığı ilk tepki hareketinin ardından düzeltmesini yaptığı 0.69 - 0.81 Fibonacci optimizasyon bandı, long yönlü pozisyona dahil olmak için asimetrik bir risk/ödül oranı sunmaktadır. Formasyonun iptal seviyesi (1 çizgisi) stop kabul edilerek, üst taraftaki majör direnç yapısı hedeflenmiştir.
Giriş Alanı: 0.69 - 0.81 Kutusu
Stop-Loss: 1 Seviyesi altı (3S mum kapanışı)
Ana Hedef (TP): 65.500 (0 Seviyesi)
ENG Following the completion of the previous bearish expansion, BTCUSDT has tapped into a major HTF demand area on the 3-hour chart, printing a high-probability Butterfly Harmonic Pattern.
The initial reaction from the absolute bottom shows early signs of a trend reversal. The subsequent corrective pullback into our optimized entry window—the 0.69 - 0.81 Fibonacci retracement zone—provides an asymmetric risk-to-reward ratio (R:R > 1:4) for a long positioning.
While navigating this counter-trend setup, maintaining strict risk discipline remains paramount. The invalidation level is clearly defined just below the harmonic completion point.
Entry Zone: 0.69 - 0.81 Optimisation Box (Current Consolidation Area)
Stop-Loss: Just below Level 1 (Invalidation point on 3H close)
Take-Profit (TP): 65,500 (Level 0 / Major Supply & Equilibrium)
#bitcoin #btcusdt #harmonic #butterfly #long #priceaction

การนำเสนอที่เกี่ยวข้อง
คำจำกัดสิทธิ์ความรับผิดชอบ
ข้อมูลและบทความไม่ได้มีวัตถุประสงค์เพื่อก่อให้เกิดกิจกรรมทางการเงิน, การลงทุน, การซื้อขาย, ข้อเสนอแนะ หรือคำแนะนำประเภทอื่น ๆ ที่ให้หรือรับรองโดย TradingView อ่านเพิ่มเติมใน ข้อกำหนดการใช้งาน
การนำเสนอที่เกี่ยวข้อง
คำจำกัดสิทธิ์ความรับผิดชอบ
ข้อมูลและบทความไม่ได้มีวัตถุประสงค์เพื่อก่อให้เกิดกิจกรรมทางการเงิน, การลงทุน, การซื้อขาย, ข้อเสนอแนะ หรือคำแนะนำประเภทอื่น ๆ ที่ให้หรือรับรองโดย TradingView อ่านเพิ่มเติมใน ข้อกำหนดการใช้งาน