
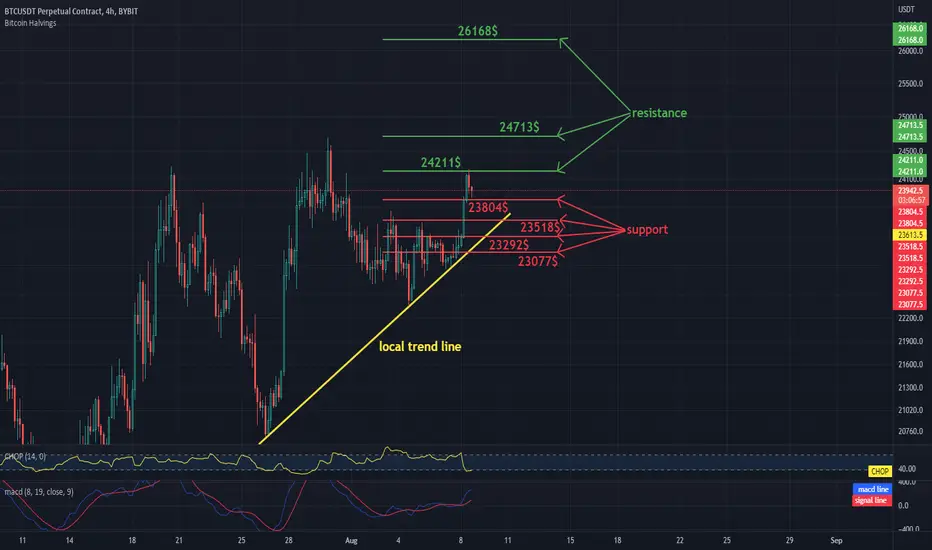
Hello everyone, let's take a look at the BTC to USDT chart on a 4 hour timeframe. As you can see, the price is moving above the local uptrend line marked with the yellow line.
Let's start with the designation of the support line and as you can see the first support in the near future is $ 23,804, if the support breaks, the next support is $ 23,518, $ 23,292 and $ 23,077.
Now let's move from the resistance line as you can see the first resistance is $ 24,211, if you can break it the next resistance will be $ 24,713 and $ 26,168.
Looking at the CHOP indicator, we can see that in the 4-hour interval the energy has been used, and the MACD indicator shows a local upward trend.
Let's start with the designation of the support line and as you can see the first support in the near future is $ 23,804, if the support breaks, the next support is $ 23,518, $ 23,292 and $ 23,077.
Now let's move from the resistance line as you can see the first resistance is $ 24,211, if you can break it the next resistance will be $ 24,713 and $ 26,168.
Looking at the CHOP indicator, we can see that in the 4-hour interval the energy has been used, and the MACD indicator shows a local upward trend.

คำจำกัดสิทธิ์ความรับผิดชอบ
ข้อมูลและบทความไม่ได้มีวัตถุประสงค์เพื่อก่อให้เกิดกิจกรรมทางการเงิน, การลงทุน, การซื้อขาย, ข้อเสนอแนะ หรือคำแนะนำประเภทอื่น ๆ ที่ให้หรือรับรองโดย TradingView อ่านเพิ่มเติมใน ข้อกำหนดการใช้งาน
คำจำกัดสิทธิ์ความรับผิดชอบ
ข้อมูลและบทความไม่ได้มีวัตถุประสงค์เพื่อก่อให้เกิดกิจกรรมทางการเงิน, การลงทุน, การซื้อขาย, ข้อเสนอแนะ หรือคำแนะนำประเภทอื่น ๆ ที่ให้หรือรับรองโดย TradingView อ่านเพิ่มเติมใน ข้อกำหนดการใช้งาน